


 Sonar Tracker
Results and the school year
Headline Trends and Qualification Trends
The trends reports in Sisra Analytics set your school’s exam results from recent years side by side. Headline Trends compares the headline measures, and Qualification Trends compares one qualification’s grades. Each has a KS3/4 version and a KS5 version, and all four use only Exams data sets.
Where to find them: select REPORTS, then the KS 3/4 or KS5 tab. In the Qualification and Headline Trends Reports banner, select VIEW THE HEADLINE TRENDS REPORT or VIEW THE QUALIFICATION TRENDS REPORT. See Open the KS3/4 reports or Open the KS5 reports.
Who can see them: staff who can open that key stage’s reports and whose authority group has View Qualification Report. Without it, the reports home shows no trends banner. Some results are hidden from staff without View Locked Reports or View Embargo Reports: see Which results they include.
The examples use the demo school’s leavers. It has five years of KS4 results, from 21/22 to 25/26, and four years of KS5 results, from 22/23 to 25/26. Some of the demo school’s figures repeat exactly from one year to another, which is unlikely in a real school.
Which results they include
Section titled “Which results they include”Each column is one cohort’s Exams data set, such as 25/26 Exams. The reports cover the six most recent cohorts, including the current year 11 or year 13. A current cohort has no exam results until its results day, so for most of the year they show up to five years.
A year appears once its Exams data set has been published, and Headline Trends needs it published with headline figures turned on. Each column shows the data set as it was last published. That includes its DfE rules year, estimates, Sisra Data Collaboration figures and value added national data. Republishing a data set changes its column.
The trends leave out results that a member of staff cannot open:
- during the results day embargo, staff without View Embargo Reports do not see results published inside the window
- a Locked Exams data set is left out for staff without View Locked Reports
So two members of staff can see different trends. The demo school has no locked or embargoed results, so its screenshots show every year. Report status and the results embargo explains both.
Headline Trends
Section titled “Headline Trends”Headline Trends sets the headline measures from each year’s exam results side by side. The KS3/4 version is headed KS3/4 Headline Trends and the KS5 version KS5 Headline Trends.
Options
Section titled “Options”| Option | What it does | Default |
|---|---|---|
| Headline Group: | The group of measures to show | Key Headlines |
| Key Filter Value: | Shows the figures for one group, such as Disadvantaged: Disadvantaged | Blank, for everyone |
| Covid Years: | Shows or hides 19/20 and 20/21, when exams were cancelled. The reports no longer reach those years, so in the 2026 to 2027 academic year it changes nothing | On |
| Export Table Data, Export All Headlines | Export the table, or every headline group, as spreadsheets |
Click here for our User Guide for this report opens a Juniper Education help centre article about the report.
| Key stage | Headline Group: choices |
|---|---|
| KS3/4 | Key Headlines, Attainment/Progress 8 Summary, Positive Progress 8, Basics 9-7, Basics 9-5, Basics 9-4, KS4 Results, EBacc Total Measure, five EBacc Elements groups, four Attainment/Progress 8 groups and Value Added |
| KS5 | Key Headlines, L3 Overall, A Level, Best 3 A Levels, AAB, Academic, Applied General, Tech Level, Tech Cert, English Progress and Maths Progress |
Most groups match a section of each key stage’s headlines report: see Headlines reports and Headlines and Performance Cohorts reports.
Key Filter Value: lists the key filter values in your published student data. In the demo school it offers Disadvantaged: Disadvantaged, Disadvantaged: Other, Gender: Female, Gender: Male, SEN: E, SEN: K and SEN: N, and also SEN: S at KS5. It works only where each cohort’s key filters are mapped and its student data published since: see Map key filters.
Read the report
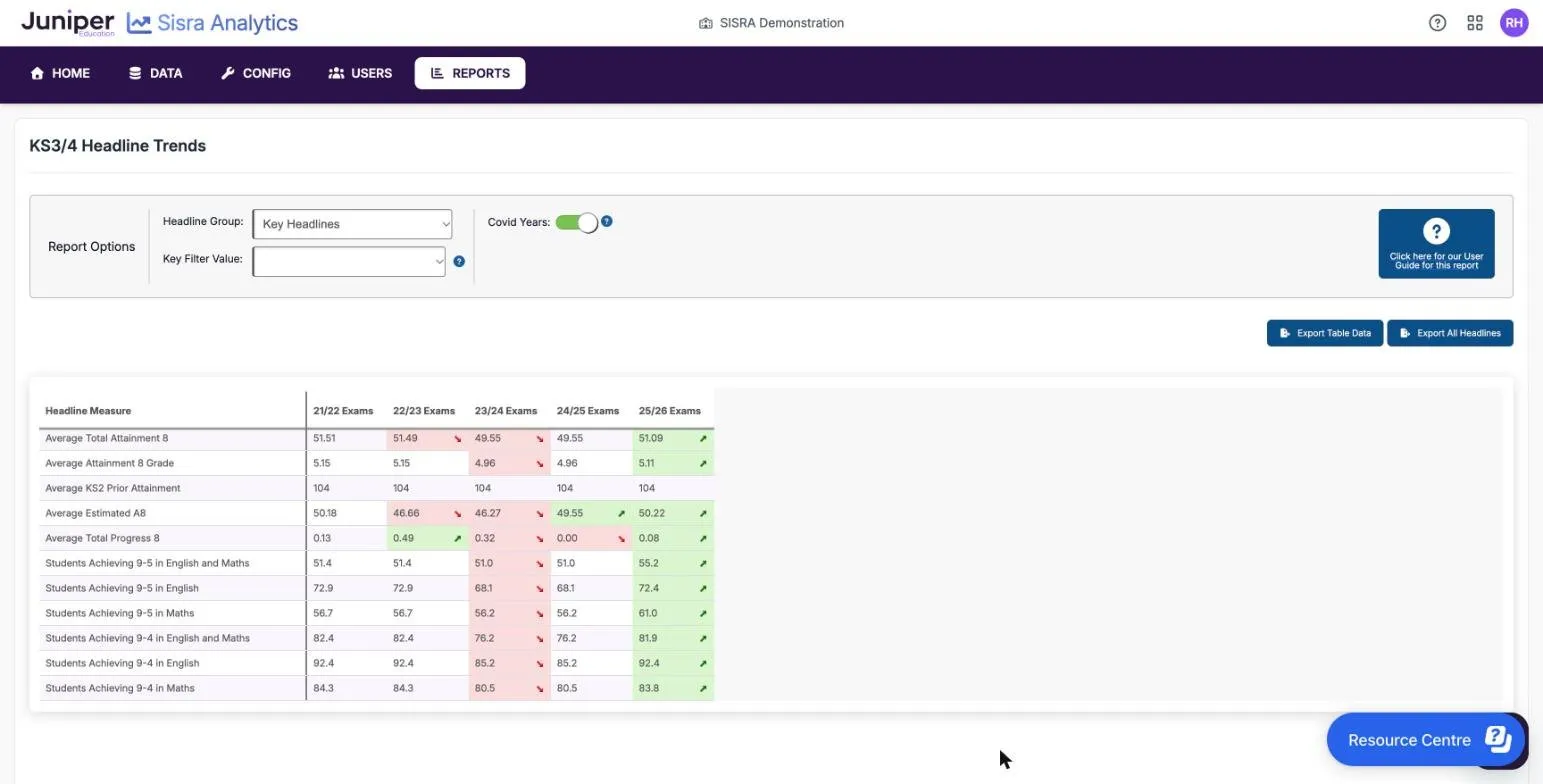
Section titled “Read the report”The table has a row for each measure, under Headline Measure, and a column for each year. Each figure is coloured against the year before it:
| Colour | Meaning |
|---|---|
| 51.09 ↗ light green, rising arrow | Higher than the year before |
| 49.55 ↘ pink, falling arrow | Lower than the year before |
| No colour | The same as the year before, or the first year shown |
Rows that count pupils or students show percentages.
At KS3/4, Key Headlines gives Attainment 8 (A8), the average Attainment 8 grade, average KS2 prior attainment, the average A8 estimate and Progress 8 (P8). It also gives grade 5 or above and grade 4 or above in English and maths, in English and in maths. At KS5, it gives four L3 Overall measures: the students included, average points per entry, Average Points per Pupil and value added.
In the demo school’s KS3/4 results, average Attainment 8 was 51.51 in 21/22 and 51.49 in 22/23. That fall of 0.02 is pink, like a large fall. Over the same two years, Progress 8 rose from 0.13 to 0.49, because the average estimate fell from 50.18 to 46.66. In 25/26, Attainment 8 rose to 51.09, and grade 5 or above in English and maths to 55.2%.
In the demo school’s KS5 results, L3 Overall Average Points per Entry was 34.47, 35.17, 35.17 and 34.47 from 22/23 to 25/26. The 24/25 figure equals the year before, so it has no colour. Yet L3 Overall VA fell from 0.72 to 0.49 that year, because value added also depends on students’ KS4 results and on the national data.
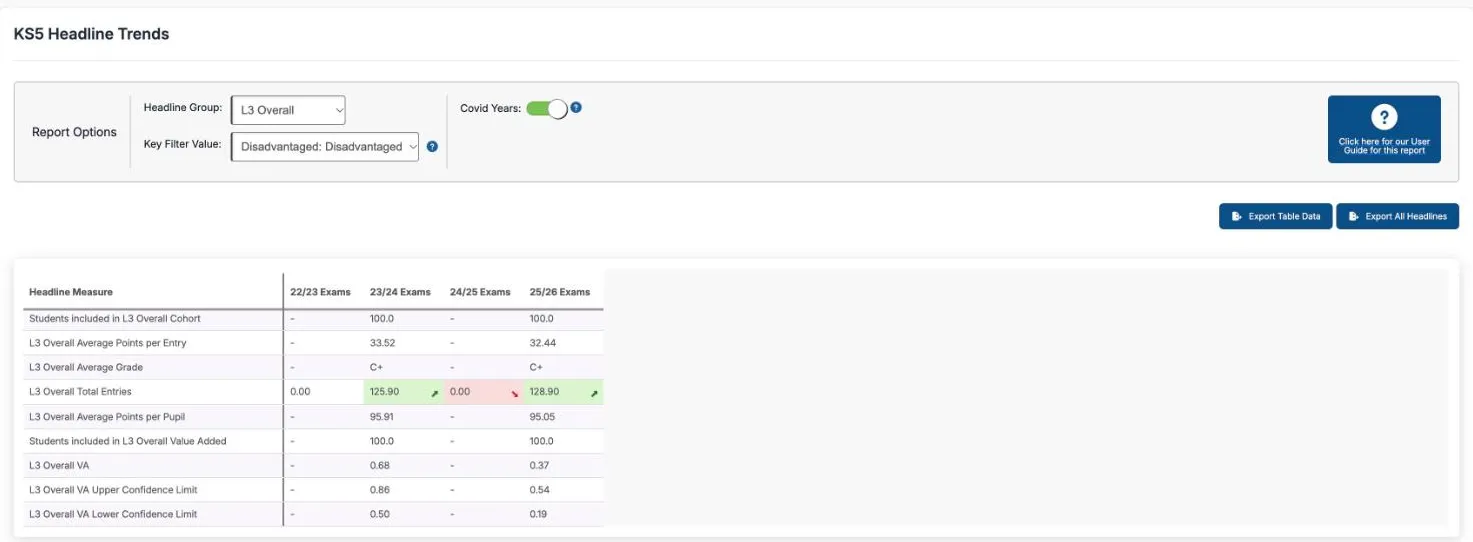
Choosing Disadvantaged: Disadvantaged in Key Filter Value: gives the KS3/4 figures for 25/26 disadvantaged pupils. Their Attainment 8 is 47.33 and their Progress 8 −0.06. At KS5, the L3 Overall figures for disadvantaged students appear only for 23/24 and 25/26. Their points per entry were 33.52 and 32.44, and their value added 0.68 and 0.37. The other two cohorts have no key filter mapping, so their columns show ”-”.
Points to watch
Section titled “Points to watch”The colours show only whether a figure went up or down. A change of 0.02 is coloured like a change of 2, so read the numbers.
In a year without key filter mapping, every row shows ”-” except L3 Overall Total Entries, which shows 0.00. So that row’s colours show falls and rises that did not happen. Ignore them.
Progress 8 needs KS2 results. The DfE published no Progress 8 for pupils who left year 11 in 2025 or 2026, because they took no KS2 tests. In a real school, those columns are blank unless the school uploaded converted KS2 scores, and any figure is then its own. The demo school has unofficial KS2 scores for these years. See Progress 8 for cohorts without KS2 results.
Sisra still reports the English Baccalaureate (EBacc). The DfE announced on 4 November 2025 that the EBacc is leaving its headline accountability measures. Do not read the EBacc rows as a target.
Qualification Trends
Section titled “Qualification Trends”Qualification Trends sets one qualification’s grades from each year side by side. The KS3/4 version is headed KS3/4 Qualification Trends and the KS5 version KS5 Qualification Trends.
Options
Section titled “Options”| Option | What it does | Default |
|---|---|---|
| Dataset | A tick for each year’s data set, such as Exams 25/26, each in its own colour. Untick a year to hide it. A count beside it, such as 5 / 5, shows how many are ticked | Every year ticked |
| Qualification: | The qualification to show | Blank |
| Key Filter Value: | As in Headline Trends. At KS5, the demo school’s maths with Gender: Female shows 23/24 and 25/26 only, with 38 grades in each | Blank |
| Export Table Data | Exports the table as a spreadsheet |
There is no Covid Years: toggle. Until you choose a qualification, the KS3/4 report says “Select a Qualification with some grades matching the filtering options to view Trend Charts”. The KS5 report says “Select a Qualification to view Trend Charts”, with a table of every qualification for every year below. Both add: “Trend analysis is only possible for qualifications which have the same name across cohorts.”
Read the report
Section titled “Read the report”Four charts show the chosen qualification. Each has a menu with Download Image.
| Chart | KS3/4 | KS5 |
|---|---|---|
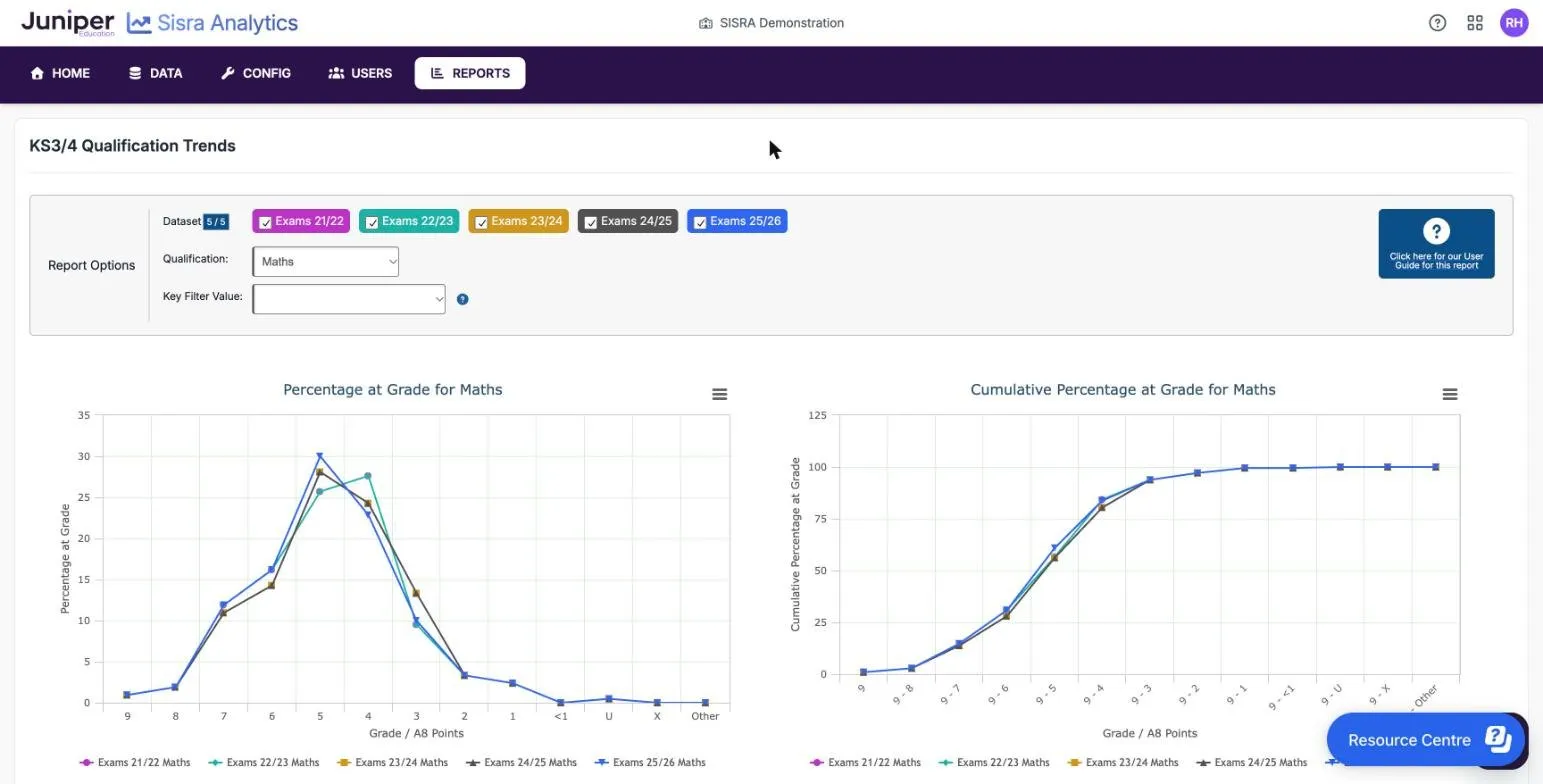
| Percentage at grade, such as Percentage at Grade for Maths | The share of grades at each grade, from 9 to 1, then <1, U, X and Other | The share at each grade, from A* to E, then U and X |
| Cumulative percentage, such as Cumulative Percentage at Grade for Maths | The share at each grade or above, such as 9 - 5 | The share at each grade or above, such as A* - C |
| Progress | Subject Progress Index for Maths: the average Subject Progress Index (SPI) of the pupils | Value Added for Maths: the qualification’s value added (VA) |
| Points | Average Points for Maths | Average Points per Entry for Maths |
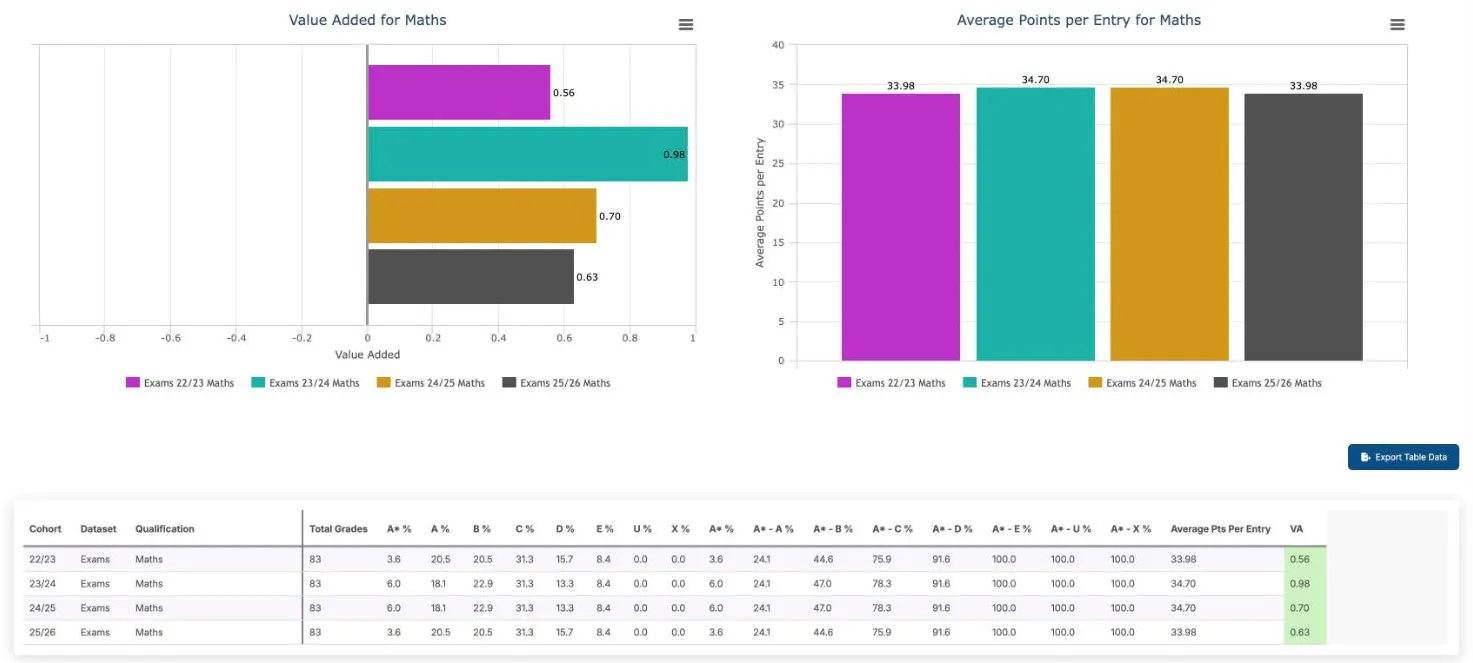
Below the charts, a table gives each year’s Total Grades, the percentage at each grade and the cumulative percentages. It ends with Average Points, SPI and Positive SPI % at KS3/4, and Average Pts Per Entry and VA at KS5. KS5 VA cells are green above 0 and pink below.
Grades sit on one scale by their points. At KS3/4, a non-GCSE grade is placed by its Attainment 8 points: a D* worth 8.5 points counts as an 8. At KS5, the report counts only level 3 qualifications. Every grade is placed on the A level scale: it needs 55 points or more to count as an A*.
In the demo school’s KS3/4 maths, average points were 4.81, 4.81, 4.73, 4.73 and 4.85 from 21/22 to 25/26. In 25/26, 61.0% of the 210 grades were 5 or above and 83.8% were 4 or above. The SPI was −0.08 in 21/22 and 0.22 in 22/23, although the grades were the same. Each year’s SPI compares with the collaboration data its data set was published with.
In the demo school’s KS5 maths, each year has 83 grades. Average points per entry were 33.98, 34.70, 34.70 and 33.98 from 22/23 to 25/26. Value added was 0.56, 0.98, 0.70 and 0.63. In 25/26, 3.6% of grades were A*, and 3.6 + 20.5 + 20.5 + 31.3 = 75.9% were A* to C. The 23/24 and 24/25 grades are the same, yet their value added is 0.98 and 0.70.
Points to watch
Section titled “Points to watch”The trends match a qualification by its name, so it needs the same name in every cohort. Names are case-sensitive: ART and Art are two qualifications. The demo school’s KS5 list has Science Chemistry and Chemistry, so chemistry splits in two. Your administrator can rename a qualification on the Matching page, then republish. See Rename a qualification at KS3/4 or Rename a qualification at KS5.
Percentages are shares of grades, not of pupils or students. A subject with few entries moves a long way when one grade changes.
The cumulative chart’s axis runs above 100%, to 125 at KS3/4 and 120 at KS5. Read the values on the lines.
The SPI comes from Sisra Data Collaboration, so a year published without collaboration figures has no SPI. See Subject Progress Index.
Before you compare years
Section titled “Before you compare years”So nationally, 2022 results were higher than 2023’s. In 2026 to 2027, the trends can still show 2022 results, in the 21/22 Exams column. Ofqual’s approach to grading in 2022 (GOV.UK, 30 September 2021) explains that year.
Ofqual’s letter to governors and trustees about 2023 results (GOV.UK, 3 July 2023) gave advice on this. A lower profile than in 2022, it said, “does not indicate any change to the underlying performance” of a school. It advised comparing 2023 with 2019 instead.
The rules change between years. At KS3/4, each year’s figures follow the rules year chosen in DfE Rules from: when it was published. See The DfE rules year. The DfE’s measures change as well. For example, it published no Progress 8 for pupils who left year 11 in 2025 or 2026.
The figures that results are compared with change too. In the demo school’s KS3/4 trends, the average Attainment 8 estimate ranges from 46.27 to 50.22. The SPI compares with each year’s Data Collaboration, and KS5 value added with the national data chosen for each cohort.
The most recent year’s column may still use an earlier year’s estimates or national data. It changes only when your administrator republishes the Exams data set with that year’s figures. See Which estimates the figures use and Which year’s national data.
One year’s change is not a trend. Look at three years or more, give the number of pupils or students behind each figure, and see Take care with small groups.