


 Sonar Tracker
KS5 reports
Headlines and Performance Cohorts reports
Headlines gives a sixth form cohort’s headline measures in one place, for the whole cohort. Performance Cohorts takes the attainment and value added measures down to groups and individual students, one performance cohort at a time. How Sisra calculates the KS5 measures explains how Sisra Analytics works out each measure.
Where to find them: select Headlines or Performance Cohorts under STANDARD REPORTS on the reports home, or on the REPORTS bar of any report. See Open the KS5 reports.
Who can see them: authority groups with View EAP KS5 Reports and View Headline Report, which Admin and User have by default.
Both reports need a data set published with Produce DfE-based Headlines figures on. They count only students who are eligible for the DfE’s 16 to 19 measures, which depends on each student’s status and entries. See Who counts.
The worked examples use the demo school’s 26/27 cohort, this year’s year 13, and its Y12 Spring collection of predicted grades. Its value added uses the DfE’s national data for 2025, which Sisra lists as 2025 Revised.
Value added for a current cohort
Section titled “Value added for a current cohort”Unlike Progress 8 at KS4, the DfE publishes level 3 value added for students who completed in 2025 and in 2026. For a leavers cohort, your administrator can choose the national data for the year the students were reported in, once it is available.
Headlines
Section titled “Headlines”Headlines opens at Headlines Summary for the Whole Cohort. That is its only view and its only grouping.
Options
Section titled “Options”| Option | What it does | Default |
|---|---|---|
| BREAKDOWN DATA BY | Splits each measure by the values of a filter, with a GAP row for a filter with two values | None |
| ADD FILTER | Narrows the figures to a group of students, such as one registration group | None |
| COMPARE WITH | Adds a second data set’s figures, such as targets | None |
KS5 report tools and options describes each one.
Read the report
Section titled “Read the report”Each section is a table with the columns Measure, Value and %. The i beside each measure explains it.
| Section | What it holds |
|---|---|
| Cohort Summary | Cohort: the students eligible for the DfE’s performance tables |
| L3 Overall | Sisra’s own cohort of every approved level 3 qualification. The DfE does not report it |
| A Level, Academic, Applied General, Tech Level | The DfE’s level 3 performance cohorts |
| Best 3 A Levels | The average of students’ three best A level grades |
| AAB | Students with grades AAB or better in three A levels, with at least two, or all three, in facilitating subjects |
| Tech Cert | Level 2 technical certificates. Sisra calculates no value added for them, although the DfE’s 16 to 19 measures for 2025 to 2026 include value added for this cohort |
| T Level | T Level students and completers, and points for the core and the occupational specialism, with no value added |
| English Progress, Maths Progress | Progress for students without grade 4 or above in GCSE English or maths, and the level 3 maths measure |
The T Level section appears only when the data set has T Level grades. Each level 3 performance cohort’s section has these measures, named after the cohort:
| Measure, in L3 Overall | What it shows |
|---|---|
| Students included in L3 Overall Cohort | Students in Cohort with an approved qualification in this performance cohort. % is their share of Cohort |
| L3 Overall Average Points per Entry | The cohort’s total points ÷ its total entries, in A level sizes |
| L3 Overall Average Grade | That average as a grade, such as C+ |
| L3 Overall Total Entries | The cohort’s entries. An A level is 1 entry and an AS level half an entry |
| L3 Overall Average Points per Pupil | The total points ÷ the students included |
| Students included in L3 Overall Value Added | Students with KS4 prior attainment and a grade that counts in value added |
| L3 Overall VA | Value added (VA), in grades, with each qualification weighted by its size. Shaded green above 0 and pink below |
| L3 Overall VA Upper Confidence Limit, L3 Overall VA Lower Confidence Limit | The range in which the school’s underlying value added is likely to lie |
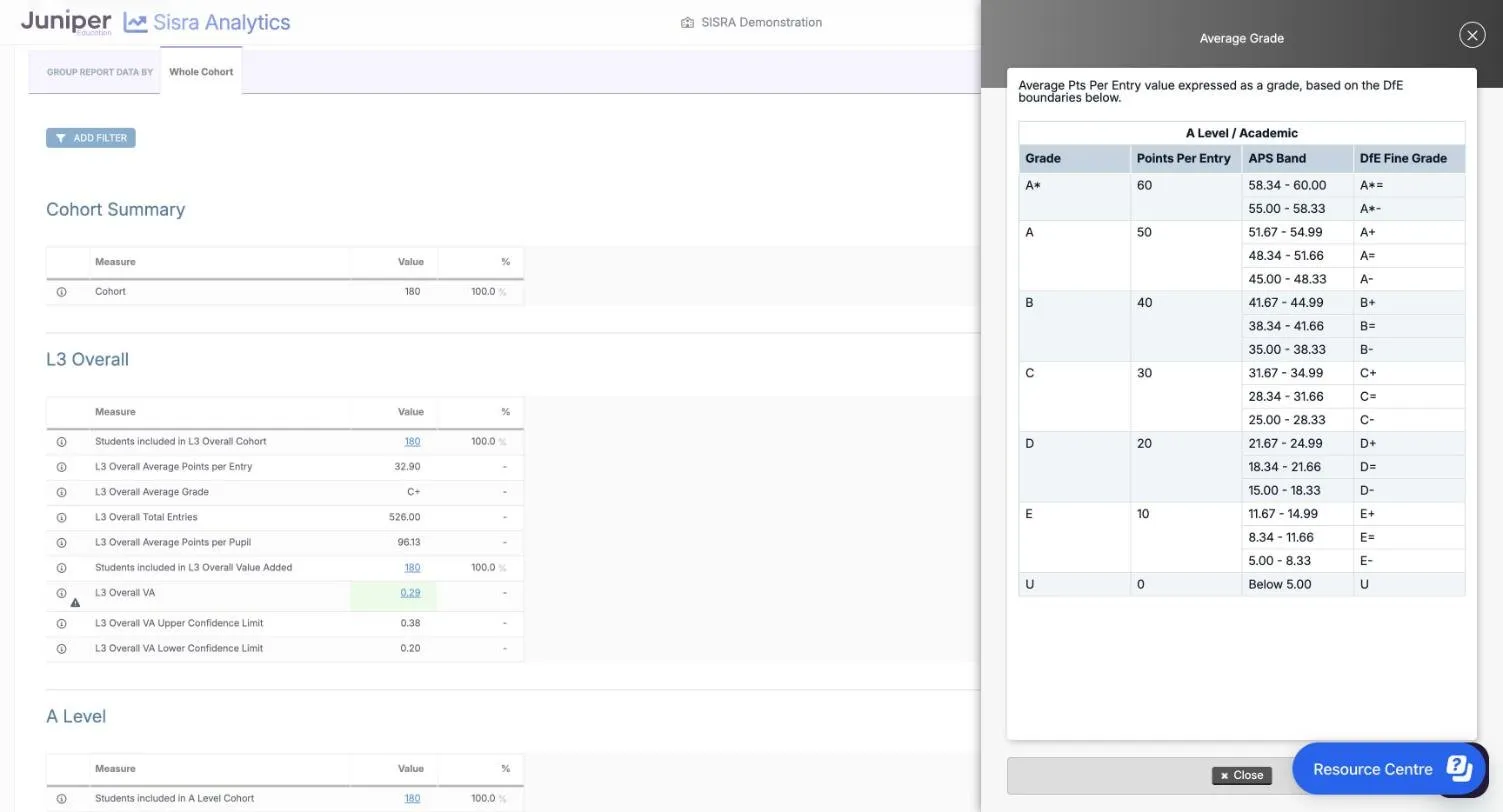
An average grade carries a +, = or - to show where the average falls within the grade, such as C+ or A=. It is not a grade any student got. Select the i on Average Grade to see the boundaries: a C+ covers 31.67 to 34.99 points per entry, for example.
In the demo school’s Y12 Spring predictions, 180 of the cohort’s 182 students count. Their 526.00 entries average 32.90 points, a C+: about 32.90 × 526 = 17,305 points in all. Shared among 180 students, that is about 96.1 points each, shown as 96.13 because Sisra uses unrounded figures. L3 Overall VA is 0.29, with limits of 0.20 and 0.38. Both limits are above 0, so on these predictions students are doing better than similar students nationally did in 2025.
The other performance cohorts in the same predictions:
| Cohort | Students | Average points per entry | VA, with its limits |
|---|---|---|---|
| A Level | 180 (100.0%) | 33.36, a C+ | 0.33, from 0.23 to 0.42 |
| Academic | 180 (100.0%) | 33.36, a C+ | 0.32, from 0.23 to 0.41 |
| Applied General | 16 (8.9%) | 29.06, a Merit+ | 0.90, from 0.53 to 1.28 |
| Tech Level | 14 (7.8%) | 20.71, a Merit- | −1.40, from −1.86 to −0.93 |
| Tech Cert | 10 (5.6%) | 5.00, an L2P= | None |
Tech level’s limits are both below 0, so its value added is significantly below that of similar students nationally. The Tech Cert section counts entries in GCSE sizes. Its 10 students have 40.00 entries at 5.00 points each: 200 points, or 200 ÷ 10 = 20.00 per student.
The other sections in the same predictions:
- Best 3 A Levels includes 158 students (87.8%), with Average Total Points of 90.38 and Average Points of 90.38 ÷ 3 = 30.13, a C=
- AAB includes the same 158 students. Of them, 11 (7.0%) are predicted AAB with at least two facilitating subjects, and 3 (1.9%) with all three
- English Progress includes 14 students (7.8%), with Average English Progress of 0.43. Of the 14, 8 (57.1%) have a positive score
- Maths Progress includes 15 students (8.3%), with an average of 0.73. Of the 15, 11 (73.3%) have a positive score
- the level 3 maths measure includes the other 165 students (91.7%), and 83 of them (50.3%) are predicted an approved level 3 maths qualification
In the demo school, every student who counts is in one maths measure or the other: 15 + 165 = 180. Best 3 A Levels and Eng/Mat Progress reports shows the students behind these figures.
With Compare or a breakdown
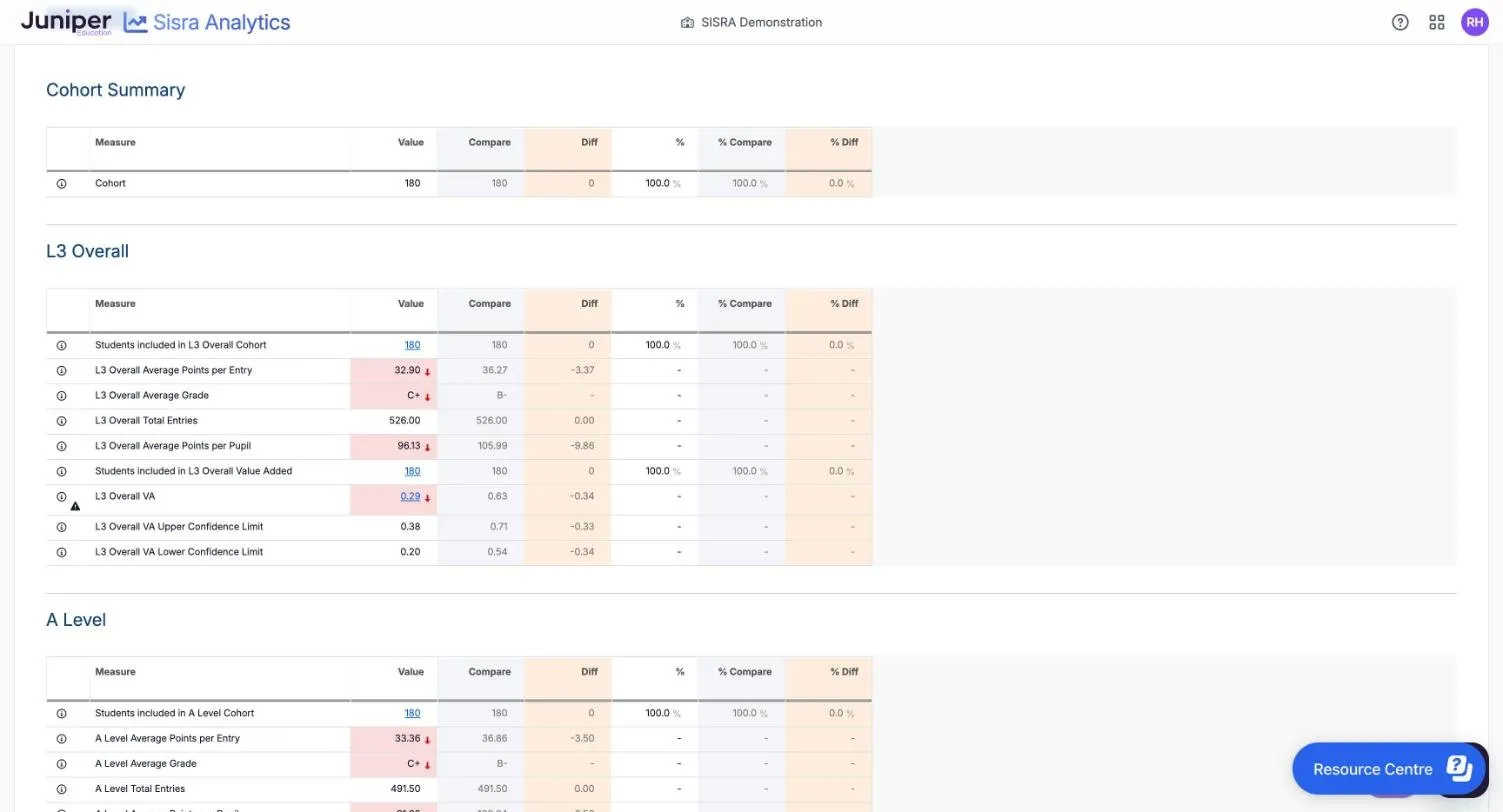
Section titled “With Compare or a breakdown”With COMPARE WITH set, each measure gains the other data set’s figure, the difference or both. Against Targets, the Y12 Spring predictions average 32.90 points per entry against 36.27, a B-, so the difference is −3.37. L3 Overall VA is 0.29 against 0.63, and L3 Overall Average Points per Pupil 96.13 against 105.99. These lower figures are pink with a down arrow, but the confidence limits have no colour.
With BREAKDOWN DATA BY set to Disadvantaged, the 44 disadvantaged students average 31.20 points per entry, against 33.44 for the other 136. The GAP row gives 31.20 − 33.44 = −2.24. Confidence limits have no breakdown rows. See Breakdown Data By and GAP.
Points to watch
Section titled “Points to watch”Cohort is not everyone on roll. Students with the status On Roll, Year 12 Only or Year 13 Only must have enough entries to count. They need at least two qualifications the size of an A level, or one twice that size. Guests never count. In the demo school, 180 of the 182 students count.
Most percentages are shares of Cohort. Four kinds are not:
- Students included in L3 Overall Value Added is a share of the L3 Overall cohort
- the AAB achievements are shares of the students included in AAB
- positive progress scores are shares of the students included in that measure
- students achieving an approved level 3 maths qualification are a share of those in the level 3 maths measure
The performance cohorts overlap. A student with A levels counts in both A Level and Academic. One who also takes an applied general qualification counts in Applied General too. So the cohorts’ students add up to more than Cohort. L3 Overall is Sisra’s own summary: compare the DfE’s cohorts, not L3 Overall, with the DfE’s published figures.
Small cohorts swing a long way. Tech Level has 14 students in the demo school, so one student’s grade moves its average and value added noticeably. Read the confidence limits with every value added figure: limits that span 0 mean the figure is not significantly different from similar students nationally.
These are predicted grades, while the national data comes from exam results. Read each value added figure for predictions as a question about the predictions, not a measure of the course.
The demo school has no T Level grades, so no screenshot shows the T Level section. It gives Students included in T Level Cohort and Students entered and completing T Level. Completing means passing the core, the occupational specialism and the industry placement. It also gives average points per entry and an average grade for the core and for the occupational specialism, separately. It has no value added, because the DfE publishes none for T Levels: see T Levels.
Sisra does not calculate the DfE’s retention measure, and the DfE’s destination measures are not in Sisra.
Performance Cohorts
Section titled “Performance Cohorts”Performance Cohorts shows one performance cohort’s attainment and value added, for groups of students or for each student. Choose the cohort on the VIEWS bar.
Options
Section titled “Options”| Option | What it does | Default |
|---|---|---|
| The view | L3 Overall, A Level, Academic, Applied General, Tech Level or Tech Cert | L3 Overall in the demo school. Your administrator can choose another in KS5 Report Settings |
| GROUP REPORT DATA BY | Groups or Students | Students |
| UPDATE STUDENT INCLUSION | Shows only the students who count in the view’s cohort | Every student |
| BREAKDOWN DATA BY | Splits each row by the values of a filter. Not available at Groups | None |
The Tech Cert view moves the performance level on the VIEWS bar to Tech Cert.
Read the report by student
Section titled “Read the report by student”At Students, the table has a row for each student in the cohort. Its title names the view, such as L3 Overall Summary.
| Column | What it shows |
|---|---|
| Filter Tags | Your school’s tags for filter values, such as Disad in green and ATT in amber in the demo school |
| Included in L3 Overall Cohort | Y, in light green, if the student counts in the cohort, or N |
| Total Grades | The student’s grades in the data set |
| Total Entries | Their entries, in A level sizes. X grades count as no entries |
| Average Points per Entry | Their points ÷ their entries |
| Average Grade | That average as a grade |
| Included in L3 Overall VA | Y if the student counts in the cohort’s value added |
| Average L3 Overall VA | The student’s value added: green above 0 and pink below, deeper the further from 0 |
The column headings follow the view, such as Included in A Level Cohort. The Tech Cert view has no value added columns.
In the demo school, Dobson; Aaron has 3 grades worth 2.50 entries. He averages 40.00 points per entry, a B=, with value added of 0.82. Fairbrother; Connor has 3 grades worth 3.00 entries, averaging 28.33, a C-, with value added of −0.54. Further down, Garside; Dylan shows N, so his grades are left out of the cohort’s headline figures.
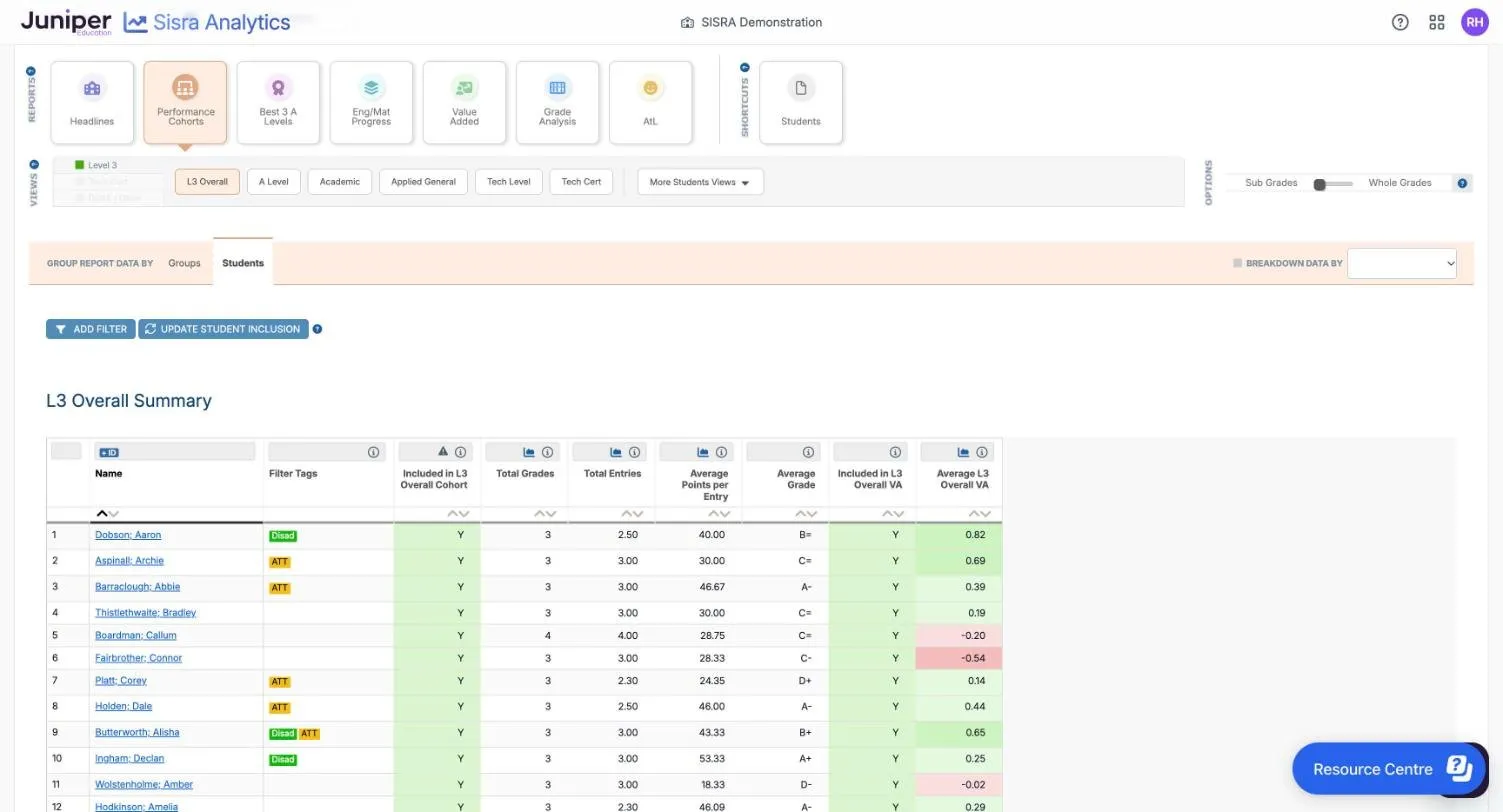
Until you select UPDATE STUDENT INCLUSION, the Summary row counts every student, including those who show N. In the demo school it gives 32.92 points per entry, against 32.90 in Headlines.
Read the report by group
Section titled “Read the report by group”At Groups, each row is one value of one filter, such as Bursary and Yes.
| Column | What it shows |
|---|---|
| Name, Filter Value | The filter and its value |
| Student Count | The students with that value |
| Students Included in L3 Overall Cohort | Those who count in the cohort |
| Average Total Grades, Average Total Entries | Their grades and entries, per student |
| APS Per Entry | Their average points per entry. The Tech Level and Tech Cert views head it Average Points per Entry |
| Average Grade | That average as a grade |
| Students Included in L3 Overall VA | Those who count in the cohort’s value added |
| Average L3 Overall VA | Their value added, coloured as at Students |
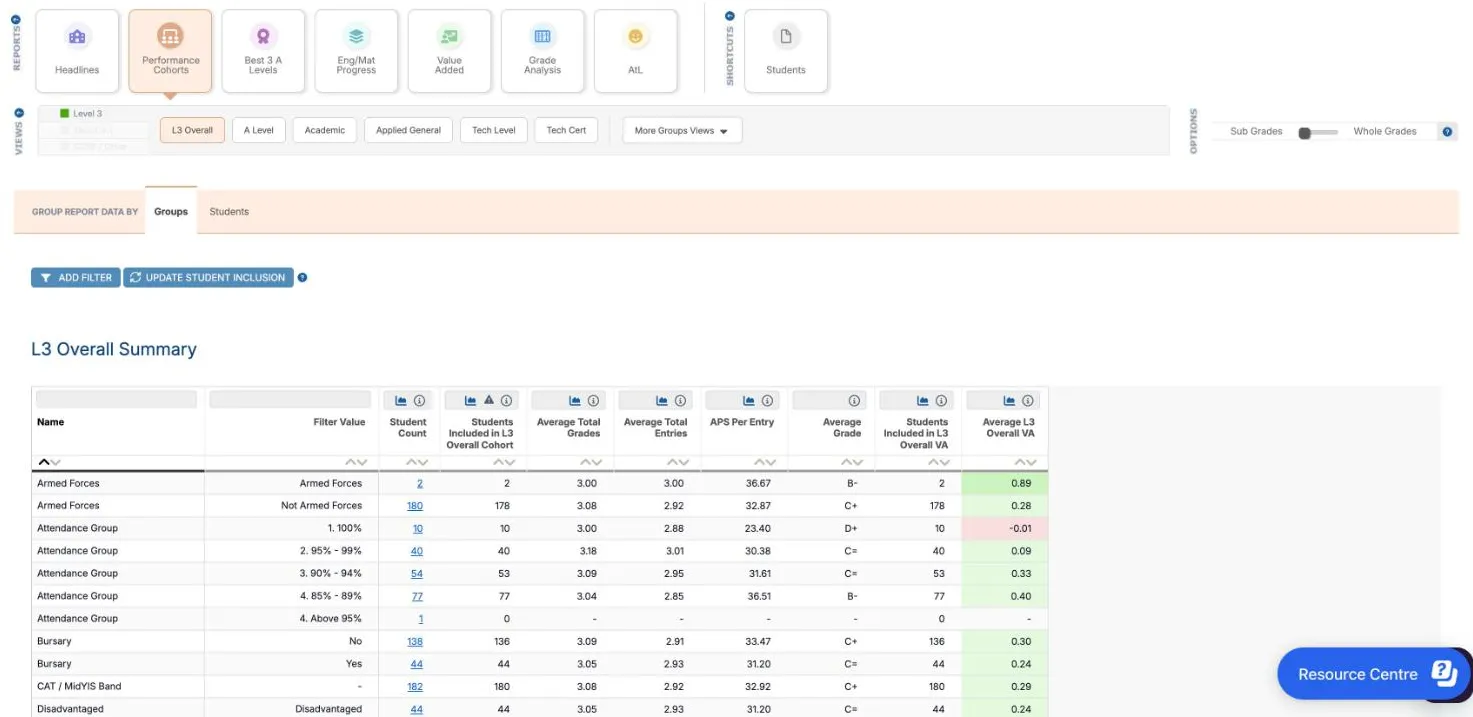
In the demo school’s L3 Overall view, all 44 disadvantaged students count, at 31.20 points per entry, a C=, with value added of 0.24. Of the 138 other students, 136 count. Their row shows 33.47, against 33.44 in Headlines, because the grades of a student who does not count are still averaged in.
Points to watch
Section titled “Points to watch”Select UPDATE STUDENT INCLUSION before you quote a figure from this report. Until you do, it includes students the measure leaves out, and a warning triangle on the Included in L3 Overall Cohort column says so. Update Student Inclusion explains the button.
Many groups are small. In the demo school, the Armed Forces row is 2 students, and one attendance group has a single student, who does not count. Give the number of students with every figure you quote, and see Take care with small groups.
Filters show each student’s value now, from the latest published student data, not their value when the grades were collected. Groups leaves out filters with more than 15 values.