


 Sonar Tracker
KS5 reports
Value Added report
The Value Added report shows level 3 value added (VA) for each qualification, class, faculty, group or student. Value added compares each grade with the results of students nationally who took the same qualification and had similar KS4 results. The report counts only the grades that count in the headline figures, so its summary matches Headlines in Sisra Analytics.
Where to find it: select Value Added under STANDARD REPORTS on the reports home, or on the REPORTS bar of any report. See Open the KS5 reports.
Who can see it: authority groups with View EAP KS5 Reports and View Headline Report, which Admin and User have by default.
The report needs a data set published with Produce DfE-based Headlines figures on. It also needs a year of national data chosen on the Value Added page, and the students’ KS4 baselines. Set up KS5 value added explains both.
The worked examples use the demo school’s 26/27 cohort, this year’s year 13, and its Y12 Spring collection of predicted grades. Its value added uses the DfE’s national data for 2025, which Sisra lists as 2025 Revised.
Options
Section titled “Options”| Option | What it does | Default |
|---|---|---|
| GROUP REPORT DATA BY | Groups, Faculties, Qualifications, Classes or Students. Classes needs a qualification | Qualifications |
| “Grade Headline Measure: Grades Included In VA” | A filter that Sisra adds and locks, with a padlock, so that the report counts only grades that count in the headline figures | Always on |
| ADD FILTER | Narrows the report, for example to one performance cohort with Qualification Type: on the Qual/Grade tab | None |
| BREAKDOWN DATA BY | Splits each row by the values of a filter. Not available at Groups | None |
| COMPARE WITH | Adds a second data set’s figures, such as targets | None |
KS5 report tools and options describes each one.
Read the report
Section titled “Read the report”| Column | What it shows |
|---|---|
| Total Grades | The grades that count in value added |
| Total Entries | Their entries, in A level sizes. An AS level is half an entry and an Extended Project 0.3 |
| KS4 Prior | The students’ average KS4 prior attainment. A levels and other academic qualifications use each student’s average GCSE points. Applied general and tech level qualifications use all their KS4 results |
| APS per Entry | The average points per entry |
| Avg VA Expectation | The average points per entry expected from students nationally with the same KS4 prior attainment |
| VA | Value added in grades, with each grade weighted by its size |
| VA Lower Confidence Limit, VA Upper Confidence Limit | The range in which the underlying value added is likely to lie |
At Faculties, a Student Count column gives the students behind each row. At Students, each row is one student across all their qualifications.
In every row, VA is the gap between APS per Entry and Avg VA Expectation, divided by 10. That is because a grade’s VA score is its points minus its expectation, divided by 10 and by the qualification’s size. Value added explains the method.
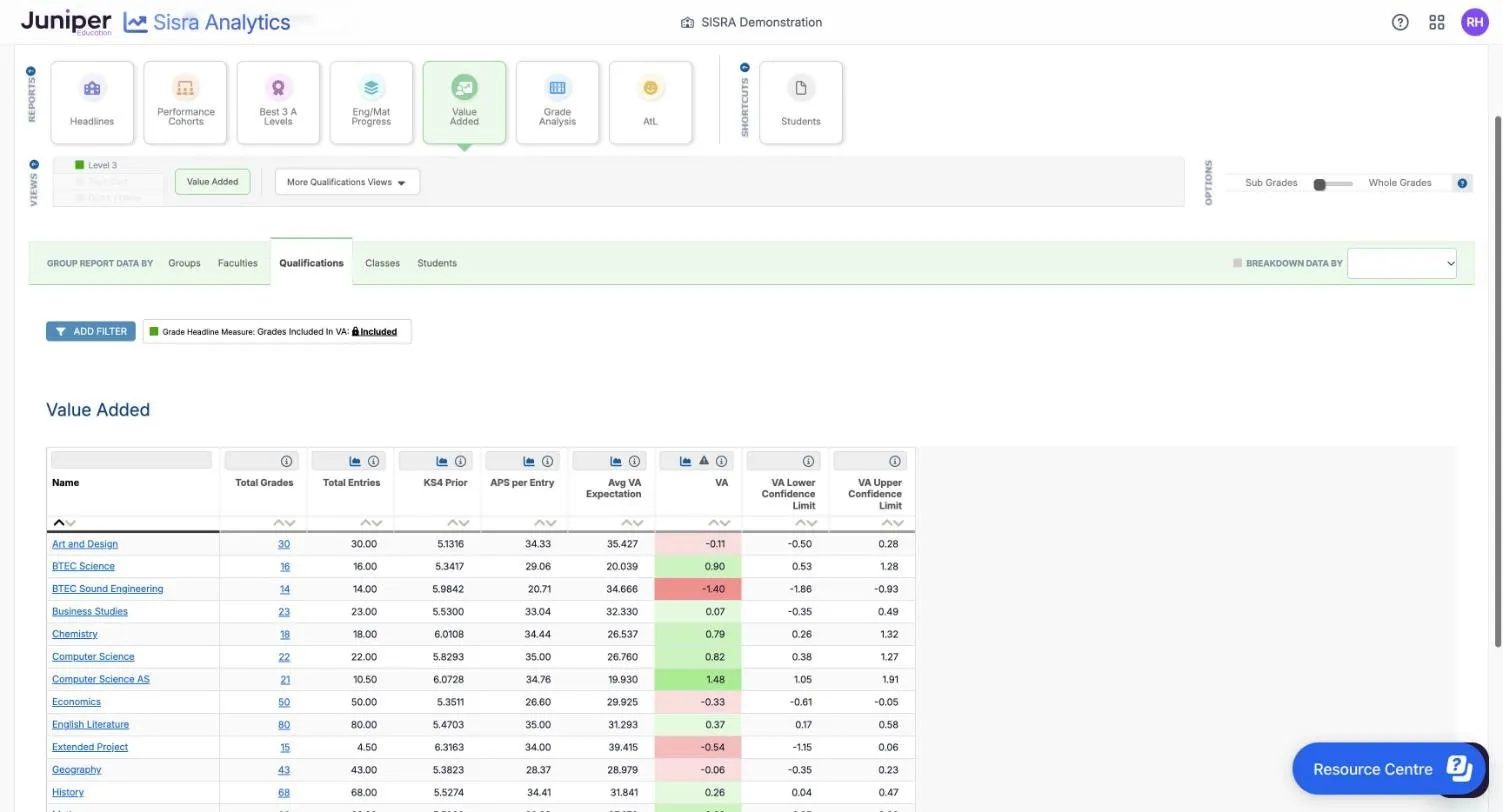
| Row in the demo school’s Y12 Spring | APS per Entry | Avg VA Expectation | VA | Limits |
|---|---|---|---|---|
| Art and Design, 30 grades | 34.33 | 35.427 | (34.33 − 35.427) ÷ 10 = −0.11 | −0.50 to 0.28 |
| Economics, 50 grades | 26.60 | 29.925 | (26.60 − 29.925) ÷ 10 = −0.33 | −0.61 to −0.05 |
| Computer Science AS, 21 grades | 34.76 | 19.930 | (34.76 − 19.930) ÷ 10 = 1.48 | 1.05 to 1.91 |
| BTEC Sound Engineering, 14 grades | 20.71 | 34.666 | (20.71 − 34.666) ÷ 10 = −1.40 | −1.86 to −0.93 |
| Summary, 555 grades | 32.90 | 29.999 | (32.90 − 29.999) ÷ 10 = 0.29 | 0.20 to 0.38 |
Art and design’s grades are about a tenth of a grade below those of similar students nationally. Its limits span 0, so the difference is not significant. Economics’ limits are both below 0, so its value added is significantly below, and computer science AS is significantly above. The summary matches L3 Overall VA in Headlines.
The computer science AS grades are worth 10.50 entries, half an entry each. Both its figures are per A level entry, so the same sum works.
At Students, Dobson; Aaron’s KS4 prior attainment is 5.7223. He averages 40.00 points per entry against an expectation of 31.765. So his value added is (40.00 − 31.765) ÷ 10 = 0.82: on average, about eight-tenths of a grade above similar students nationally.
Colours
Section titled “Colours”| Colour | Meaning |
|---|---|
| 1.48 green | Above 0. The deeper the green, the further above |
| 0.07 light green | Slightly above 0 |
| -0.11 pink | Slightly below 0 |
| -1.40 red | Well below 0. The deeper the red, the further below |
The colour shows how far a figure is from 0, not whether the difference is significant. Read the confidence limits for that.
Where the data comes from
Section titled “Where the data comes from”Each grade’s expectation comes from the DfE’s national data for the year your administrator chose, read at the student’s KS4 prior attainment. The KS4 prior attainment comes from the core baselines your administrator imports: KS4 APS GCSE (A8 Pts) and KS4 APS All (A8 Pts).
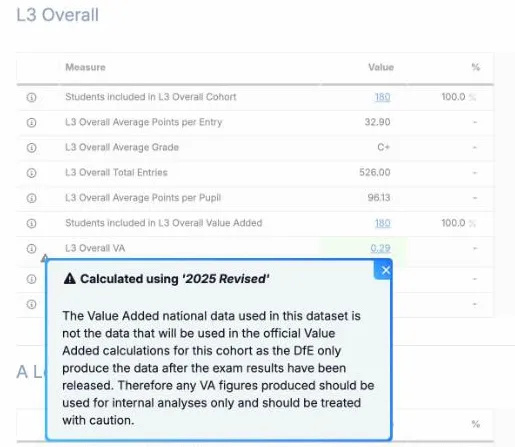
The DfE works out national value added only after each year’s results. So a current cohort uses an earlier year’s data, and a warning triangle beside each value added figure says so. For a leavers cohort, your administrator can change to the data for the cohort’s own year once it appears, then republish. Which year’s national data explains the choice.
The report leaves out grades that do not count in the headline figures. These include discounted grades and grades in unapproved qualifications. Grades of students without KS4 prior attainment, or outside the headline cohort, are left out too.
Points to watch
Section titled “Points to watch”Small groups have wide limits. Sisra sets no minimum group size, so a figure for a few grades can look large. In the demo school, the Extended Project’s 15 grades give −0.54, but the limits of −1.15 and 0.06 span 0.
Grade Analysis shows value added for every grade, so its figures can differ from this report’s. In the demo school, geography has 43 grades and −0.06 here, but 44 grades and −0.10 in Grade Analysis. Use this report for figures that compare with the DfE’s.
The locked filter can follow you. If you go from Value Added to Grade Analysis with the REPORTS buttons, it stays as an ordinary filter box. Grade Analysis then counts 555 grades instead of 560, so remove the box with its cross to see every grade.
For predicted grades, value added compares predictions with other students’ exam results. Read a figure for predictions as a question about the predictions, not a measure of the course.
Value added is in grades: 0.29 is about three-tenths of a grade per A level entry. The DfE’s value added ready reckoner shows it in points, ten times larger. To check Sisra’s figures with it, your administrator can export the grades in its layout: see The KS5 ready reckoner.
Headlines gives value added for each of the DfE’s level 3 performance cohorts: A Level, Academic, Applied General and Tech Level. Sisra calculates no value added for technical certificates or T Levels.