Sonar Tracker
Set up your school
Key stages, report settings and colour themes
The four Settings pages in CONFIG hold school-wide settings for Sisra Analytics. Colour themes and report settings change the reports straight away, for every user. A change to key stages needs student data publishing again.
Where to find them: select CONFIG, then Settings, then the page.
Who can change them: authority groups with Access Data Section, such as Admin. See Authority groups and permissions. Key Stages and KS3/4 Report Settings appear only if your school has KS3/4, and KS5 Report Settings only if it has KS5.
Colour Theme
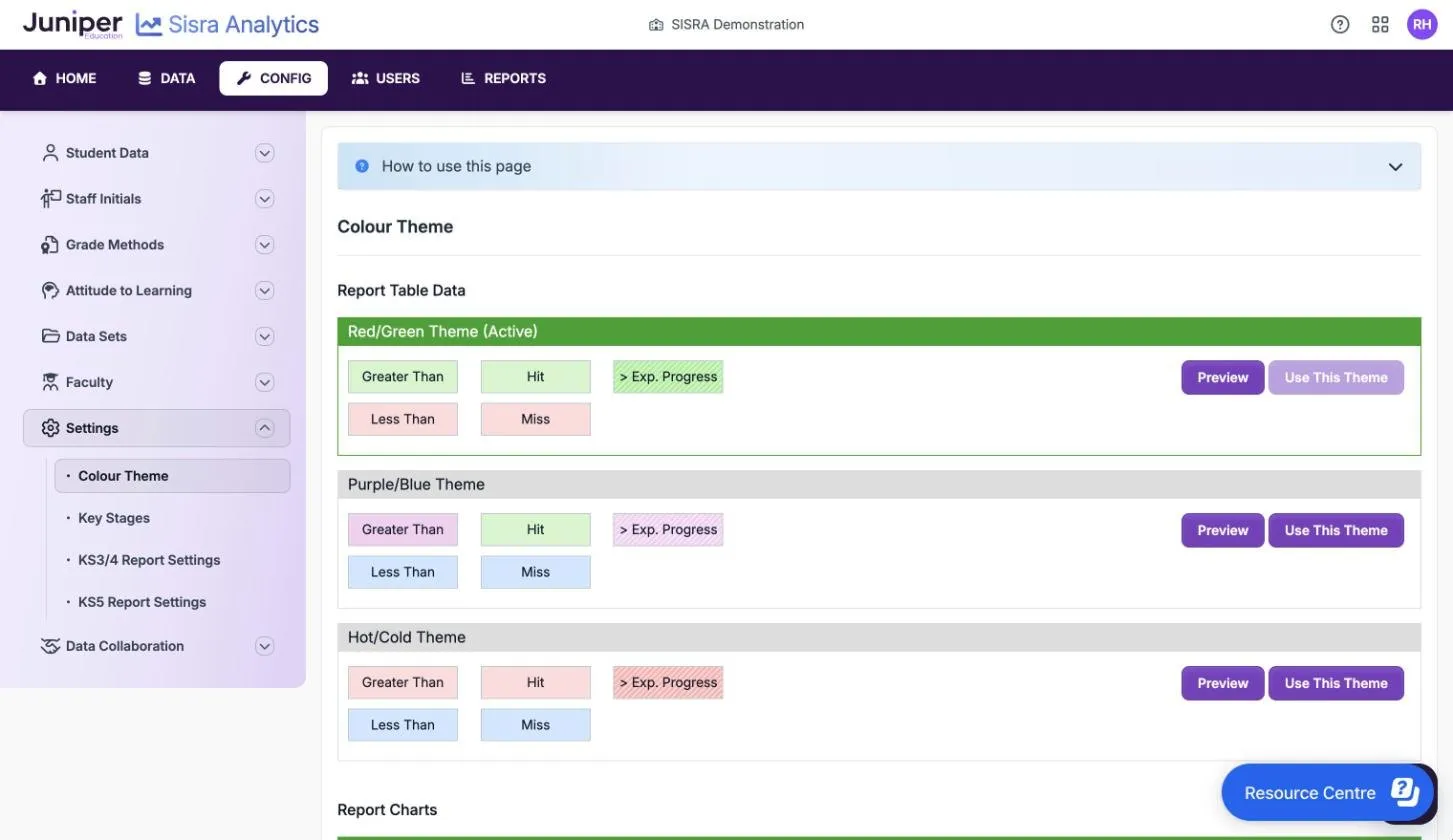
Section titled “Colour Theme”Colour Theme sets the colours that highlight figures in report tables and charts, for every user, key stage and cohort. It has two sections, each with three themes, and you choose a theme for each section separately.
| Section | Options | Default |
|---|---|---|
| Report Table Data | Red/Green Theme, Purple/Blue Theme, Hot/Cold Theme | Red/Green Theme |
| Report Charts | The same three themes | Red/Green Theme |
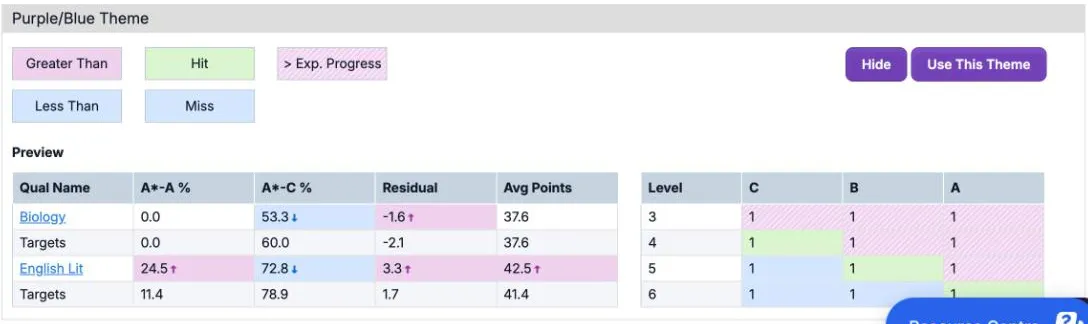
Preview shows a theme on a sample table and grid, and changes to Hide. Use This Theme applies the theme. The active theme is marked (Active), and its Use This Theme button is greyed out. Sisra confirms “Table colour coding has been successfully updated” or “Chart colour coding has been successfully updated”. There is no need to republish.
| Table sample | Red/Green Theme | Purple/Blue Theme | Hot/Cold Theme |
|---|---|---|---|
| Greater Than | Green | Purple | Red |
| Hit | Green | Green | Red |
| > Exp. Progress | Green, striped | Purple, striped | Red, striped |
| Less Than | Red | Blue | Blue |
| Miss | Red | Blue | Blue |
Greater Than and Less Than mark a figure that is above or below the figure it is compared with. Hit, Miss and > Exp. Progress mark cells that meet, fall short of or go beyond expected progress. The Report Charts samples are Upper, Middle, Fail, Actual and Compare.
Key Stages
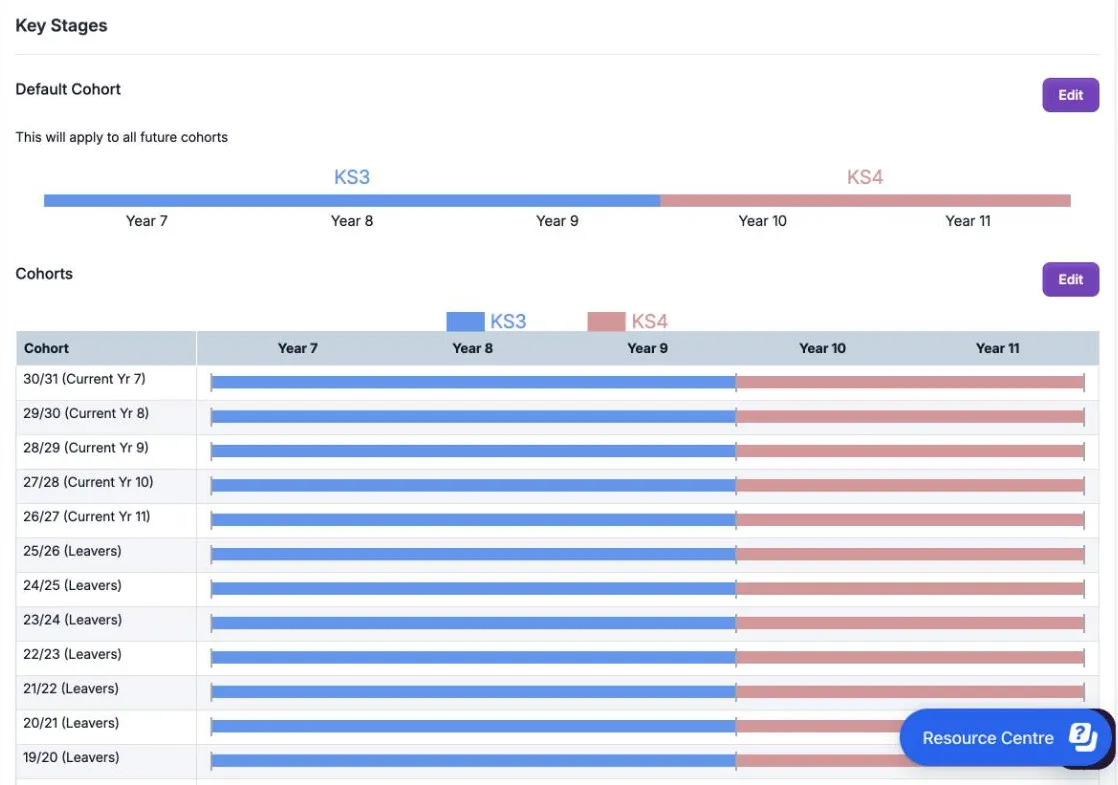
Section titled “Key Stages”Key Stages sets where key stage 3 ends and key stage 4 begins for each KS3/4 cohort. It decides which years of a cohort use its KS3 classes, and which use its KS4 classes.
| Section | What it sets | Default |
|---|---|---|
| Default Cohort | The boundary for cohorts created from now on. The page says “This will apply to all future cohorts” | KS3 is years 7 to 9 and KS4 is years 10 and 11 |
| Cohorts | The boundary for each existing cohort, from the current year 7 to the oldest leavers | The boundary set when the cohort was created |
To change a boundary, select Edit in the section, select the point between two years where KS4 starts, then select Save. Sisra confirms “Key Stage(s) successfully updated”. Then republish student data for each cohort you changed. See Publish student data.
KS3/4 Report Settings
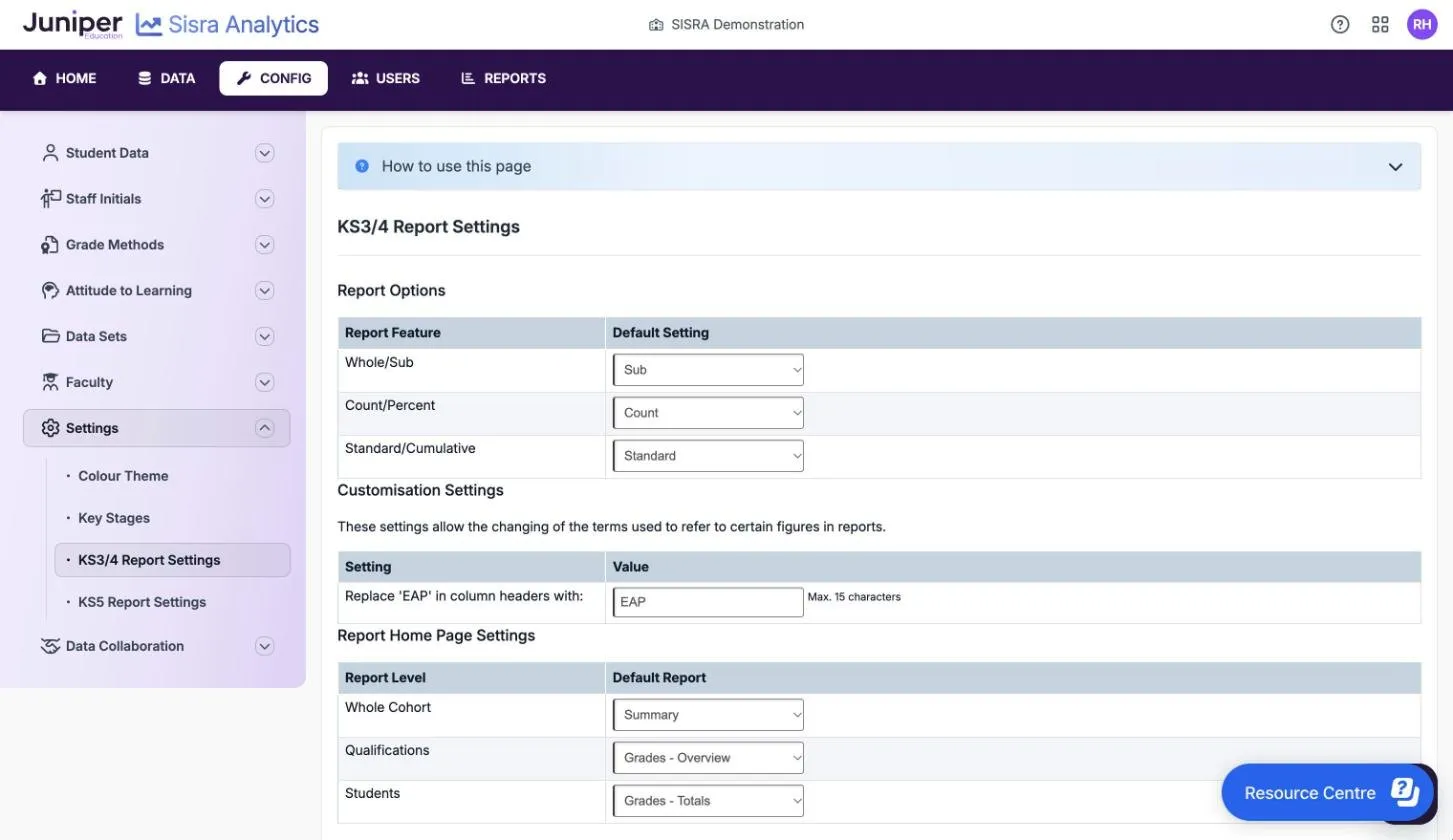
Section titled “KS3/4 Report Settings”These are the starting options for every user’s KS3/4 reports. Users can still change each option inside a report. When you change a value, a Save bar appears. Changes reach the reports without republishing, and Sisra confirms “Default Report Settings have been successfully updated”.
Report Options
Section titled “Report Options”| Report Feature | What it sets | Options | Default |
|---|---|---|---|
| Whole/Sub | Whether subgrades count in on-track figures, comparisons and colour coding | Whole, Sub | Sub |
| Count/Percent | Whether grade columns show counts or percentages | Count, Percentage | Count |
| Standard/Cumulative | Single grades, such as 9, 8 and 7, or ranges, such as 9-8 and 9-7 | Standard, Cumulative | Standard |
Customisation Settings
Section titled “Customisation Settings”| Setting | What it sets | Default |
|---|---|---|
| Replace ‘EAP’ in column headers with: | Your own word to replace EAP (Expected Attainment Pathway) in report column headings, such as Target. From 2 to 15 characters | EAP |
Report Home Page Settings
Section titled “Report Home Page Settings”These choose the report that opens from each level button on the REPORTS home page.
| Report Level | Options | Default |
|---|---|---|
| Whole Cohort | Summary, Dashboard, Charts or Filters: the four Headlines views | Summary in the demo school |
| Qualifications | Grades - Overview or Grades - Totals | Grades - Overview in the demo school |
| Students | Grades - Totals | Grades - Totals |
For Whole Cohort and Qualifications, the table gives the demo school’s settings. Juniper Education’s guides do not give a new school’s starting values.
KS5 Report Settings
Section titled “KS5 Report Settings”These work in the same way for the KS5 reports. The last column gives the demo school’s settings, which match the KS3/4 defaults where the two pages share an option.
Report Options
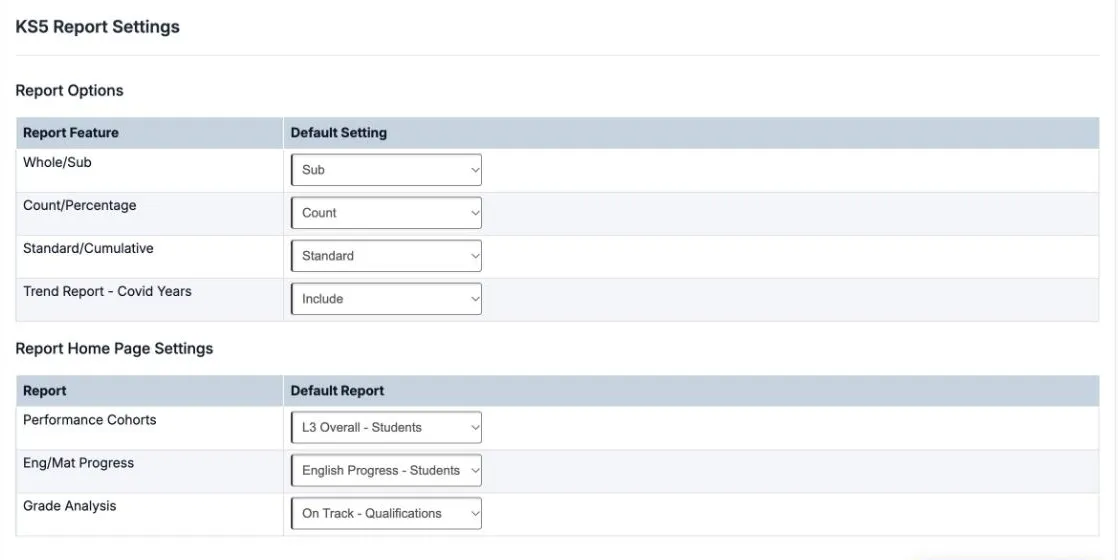
Section titled “Report Options”| Report Feature | What it sets | Options | Setting in the demo school |
|---|---|---|---|
| Whole/Sub | As at KS3/4 | Whole, Sub | Sub |
| Count/Percentage | As Count/Percent at KS3/4 | Count, Percentage | Count |
| Standard/Cumulative | Single grades, such as A*, A and B, or ranges, such as A*-A and A*-B | Standard, Cumulative | Standard |
| Trend Report - Covid Years | Whether the trend reports include results from 2019 to 2020 and 2020 to 2021, when exams were cancelled | Include, Exclude | Include |
Trend Report - Covid Years has no effect on the trend reports in the 2026 to 2027 academic year.
Report Home Page Settings
Section titled “Report Home Page Settings”These choose the report that opens first in each group of KS5 reports.
| Report | Options | Setting in the demo school |
|---|---|---|
| Performance Cohorts | L3 Overall - Students, A Level - Students, Academic - Students, Applied General - Students, Tech Level - Students or Tech Cert - Students | L3 Overall - Students |
| Eng/Mat Progress | English Progress - Students or Maths Progress - Students | English Progress - Students |
| Grade Analysis | Grade Summary - Qualifications or On Track - Qualifications | On Track - Qualifications |