


 Sonar Tracker
KS3/4 reports
Student Detail reports
The Student Detail area shows what one data set holds about one pupil. That includes their filters, each grade with its expected grade, their flight paths and their own headline measures. Use it to look at a pupil in depth, such as before a meeting about them. It has two reports, Overview and Headlines.
Where to find it: select Student Detail on the area bar, then Overview or Headlines, then Students. Selecting a pupil’s name in any other report opens their Overview.
Who can see it: authority groups with View Student Report, which Admin and User have by default.
The examples follow one fictional pupil, Barraclough; Abbie, in the demo school. The screenshots show the 25/26 leavers’ Exams, and the flight path comes from the 26/27 cohort’s Y10 Summer predictions. The demo school’s KS2 scores for 25/26 are not official. So for that cohort, the Progress 8, value added and Subject Progress Index (SPI) figures rest on unofficial scores.
Choose a pupil
Section titled “Choose a pupil”On the Options tab, choose the pupil in Student. The list gives each pupil’s surname, forename and Student ID, such as “Barraclough; Abbie - 005004”. Until you choose, the report says “Please select a Student”, and Filters, Measures, AtL, On Track and Key Characteristics are greyed out.
Student Detail always shows a pupil’s latest published filters and classes, not those when the grades were collected.
Overview
Section titled “Overview”The Overview has a section for each kind of information:
| Section | What it shows |
|---|---|
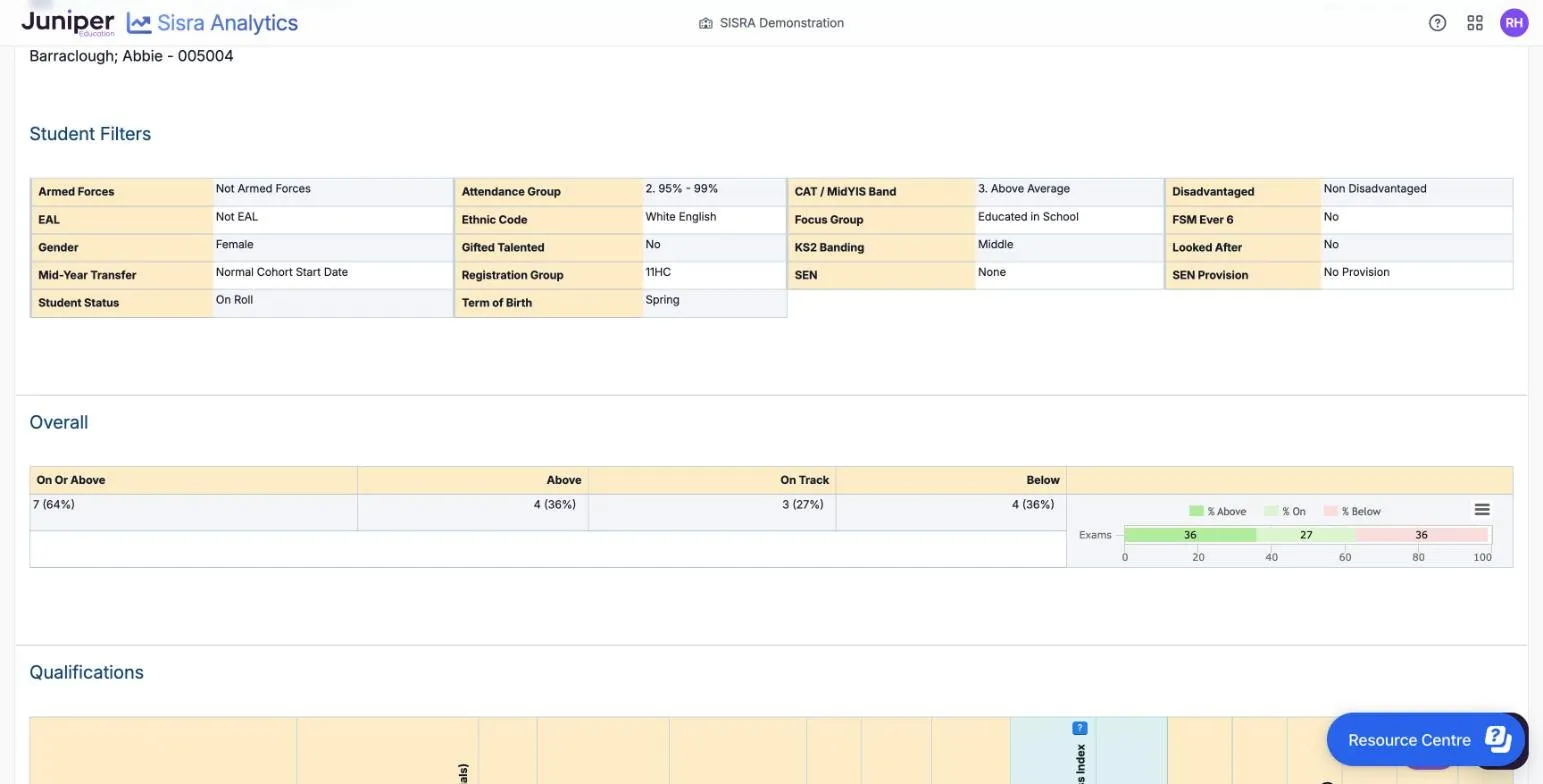
| Student Filters | The pupil’s value for each filter, such as Gender, SEN and KS2 Banding |
| Overall | How many of the pupil’s grades are above, on and below their expected grades |
| Qualifications | A row for each qualification with a grade in the data set |
| Flight paths | A chart for each qualification, if your administrator has generated flight paths that include this data set. See Flight paths |
| Legends | KS3/4 Legend and Data Collaboration Legend, explained in Legends and icons |
Overall
Section titled “Overall”| Column | What it shows |
|---|---|
| On Or Above | The grades on or above their expected grade, and their share of the pupil’s grades |
| Above | The grades above |
| On Track | The grades equal to the expected grade |
| Below | The grades below |
A bar beside the table shows % Above in green, % On in light green and % Below in pink. Only grades with an expected grade count. Sub and Whole decide whether sub-grades count: see Sub and Whole.
In the 25/26 leavers’ results, Barraclough; Abbie has 11 grades with expected grades. Four are above, 3 on and 4 below, so On Or Above is 7 (64%), because 7 ÷ 11 = 0.636.
Qualifications
Section titled “Qualifications”| Column | What it shows |
|---|---|
| Qualification Name | The qualification |
| Class (Staff Initials) | The pupil’s class, with the teacher’s initials where your school has set them up |
| Eligibility | Whether the grade can count in the headline measures, such as a green star, or a red down arrow if it is discounted |
| Type | The kind of qualification, such as GCSE (9-1), from the Matching page |
| Results Date | The date of the result, which decides the first entry |
| Grade, Points | The grade and its points |
| Residual | The grade’s points minus the pupil’s average points |
| Subject Progress Index, SPI Chart | The pupil’s SPI in the qualification |
| Attitude, Behaviour, Organisation | The pupil’s Attitude to Learning (AtL) judgements, under your school’s category names |
| EAP Grade | The grade expected from the pupil’s Expected Attainment Pathway (EAP) |
| EAP Diff (whole), EAP Diff (sub) | Whole grades and sub-grades above or below the EAP grade: green and striped above 0, pink below |
| KS2 Core | The pupil’s KS2 score in English or maths, or the average of the two for other qualifications |
| EAP Baseline | The pupil’s starting point on the EAP, such as a target grade |
Barraclough; Abbie’s art grade is 9 against an EAP grade of 6: 3 whole grades and 9 sub-grades above. Her 11 grades total 72 points, an average of 72 ÷ 11 = 6.55. So her residual is 9 − 6.55 = 2.45 in art, and 6 − 6.55 = −0.55 in physics. Her KS2 reading and maths scores are both 109, so KS2 Core is 109 in every row.
Her art graphics grade, 6, has a red down arrow: it is discounted, so it does not count in her headline measures. It still counts in Overall, which uses every grade, as one of her 4 grades below expected.
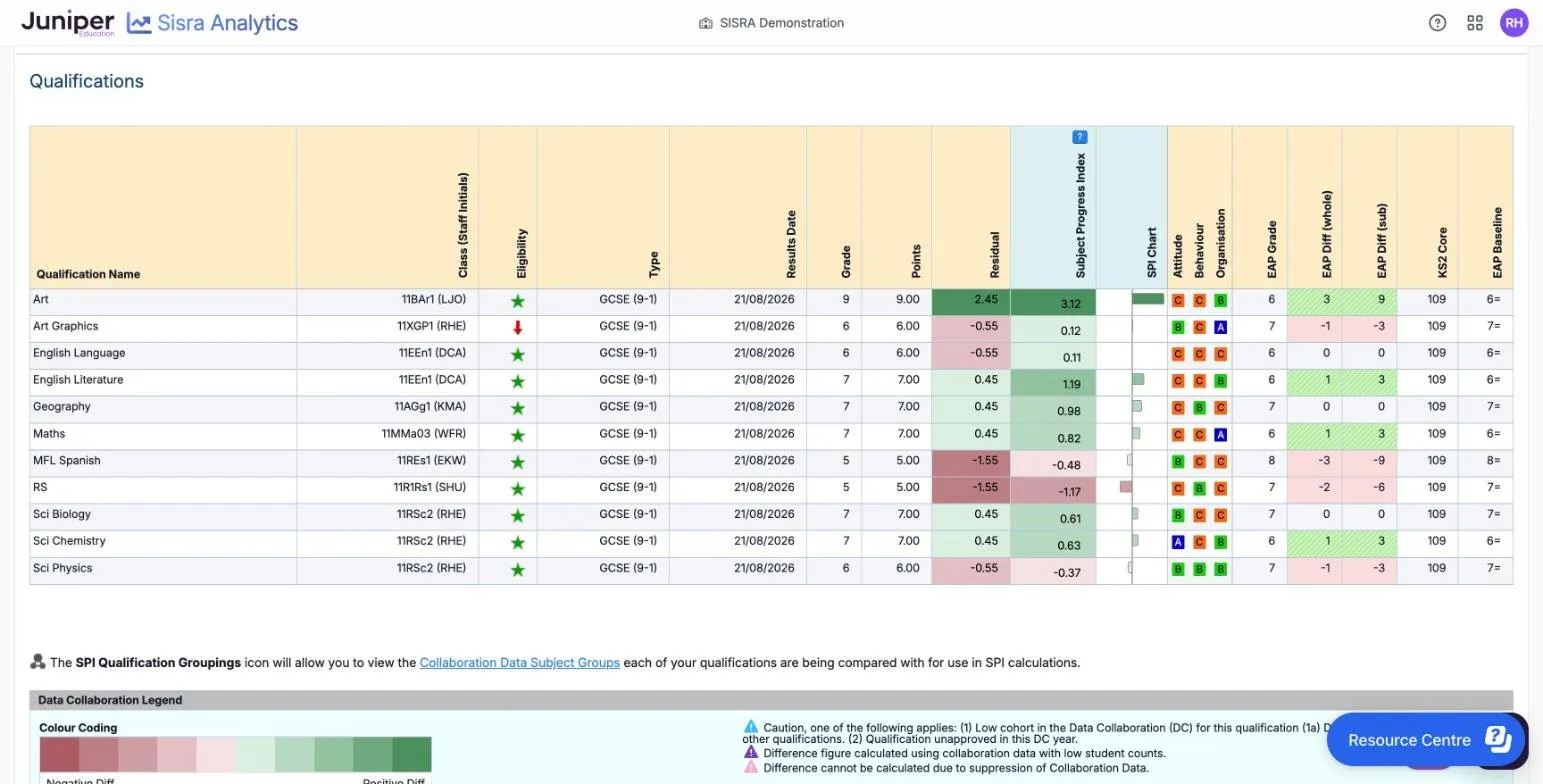
In the 26/27 cohort’s Y10 Summer predictions, the same pupil has 5 grades (45%) on or above expected and 6 (55%) below. Her art prediction is 5= against an EAP grade of 5+. That is the same whole grade but one sub-grade lower, so with Sub it counts as below.
Flight paths
Section titled “Flight paths”A flight path charts one pupil’s grades in one qualification across KS3 and KS4, against the expected grades in their EAP. It appears in the Overview, below Qualifications, for data sets that your administrator included when generating flight paths. In the demo school, the 26/27 cohort’s Y10 Summer collection has flight paths, but the 25/26 Exams does not.
If a data set in the flight path is closed to you, such as a Locked report, the chart does not show. Instead, a message starts “You do not have permission to view this Flight Path”.
Options
Section titled “Options”| Option | What it does | Default |
|---|---|---|
| The qualification list | Chooses the qualification to chart | The pupil’s first qualification |
| The chart list: Line Of Best Fit or Plotted Expectation | Chooses how the expected line is drawn. Changing it reloads the page | The chart your administrator chose when generating the flight paths |
| The menu (three lines) | Saves the chart as an image |
Read the chart
Section titled “Read the chart”| Part | What it shows |
|---|---|
| Across | KS2, then T1, T2 and T3 of Year 7 to Year 11, then KS4 |
| Up | Grades, with the baseline’s grade method on the left, such as Baseline - 9-1 Sub Grades, and the KS4 Ending Point on the right |
| Actual | Blue squares joined by a solid line: the pupil’s grade in each collection, with the grade written above |
| Expected | Green dots: the expectations from the EAP |
| Orange band | The term of the data set you are viewing |
| Grey lines | The bottom and top of the grade scale for each term |
With Line Of Best Fit, the expected line runs straight from the first expectation to the last. With Plotted Expectation, it passes through each term’s expected grade. The chart places grades by their rank in the grade method, not by their points. Two grades worth the same points can sit one above the other. The grade scale between the grey lines climbs from term to term. So a pupil who keeps the same grade still rises towards the KS4 Ending Point. Flight paths explains both charts.
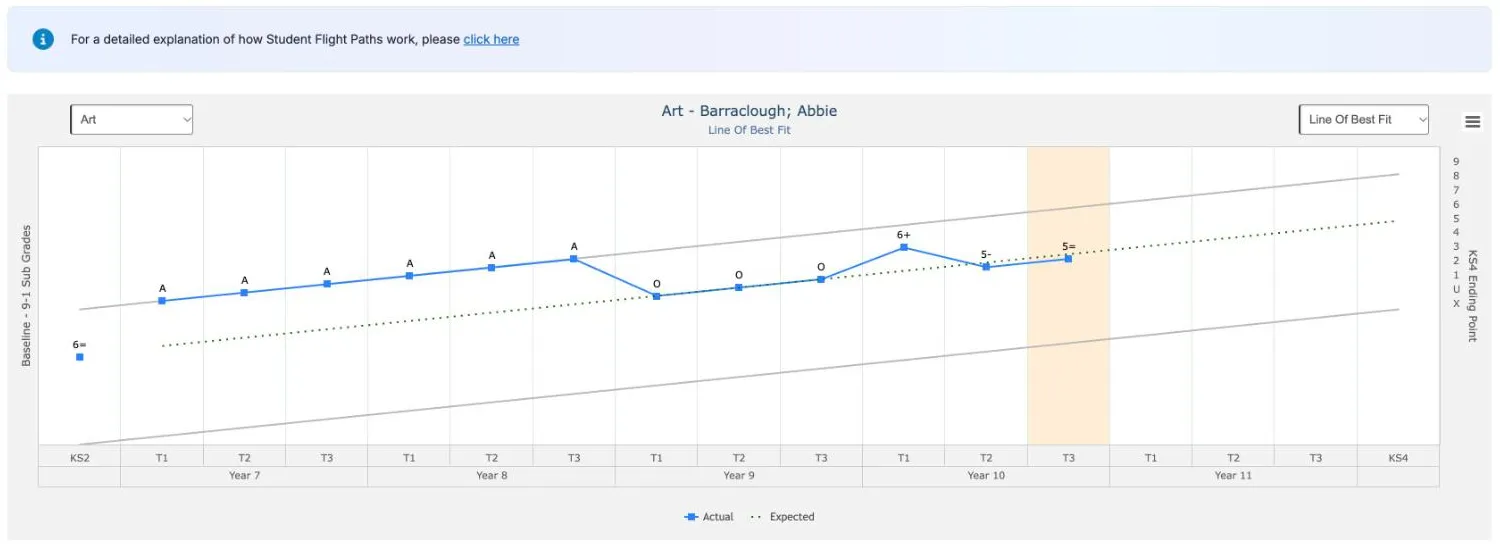
Barraclough; Abbie’s art chart, as a Line Of Best Fit:
- The first point, under KS2, reads 6=. It is her EAP baseline, a target grade, because the demo school chose the EAP’s baseline as the starting point.
- Years 7 and 8 read A and year 9 O. The demo school grades KS3 art above (A), on (O) or below expectations.
- Year 10 reads 6+, 5- and 5=, with the summer term shaded orange.
Points to watch
Section titled “Points to watch”The left axis has no grade labels, so read the grades written on the points. Pointing to a point shows nothing more.
A flight path shows your school’s expectations, not a forecast. The DfE’s 2018 report ‘Making data work’ said flight paths for pupils with similar starting points “are not valid”. What the evidence says about flight paths sets out the evidence.
Headlines
Section titled “Headlines”The Headlines report shows the pupil’s own headline measures. It needs a data set published with Headlines on. Orange banners appear when the estimates are not the ones the DfE will use for the cohort. They say the Progress 8 and value added figures are for internal use only.
Read the report
Section titled “Read the report”| Section | What it shows |
|---|---|
| Student Filters | The pupil’s value for each filter, as in the Overview |
| A8/P8 Summary | Dataset, KS2 A8 Prior, Att 8, Att 8 Estimate, Progress 8, Avg A8 Grade and Slots Filled |
| A8/P8 Detail | For the English, maths, English Baccalaureate (EBacc) and open slots, and overall: estimated Attainment 8, Attainment 8, Progress 8, slots filled and average points per entry |
| Attainment 8 Qualifications | Each qualification, with its Basket: Eng/Mat, EBacc, Open, or N/A if it does not count. Also Slots Filled, Att 8 Points and EAP Grade |
| Basics | The English and maths qualifications that count, their points, and Passed 9-5 and Passed 9-4 |
| EBacc | Entry and the standard and strong passes, for each element and overall, and the average point score |
| Value Added | For science, humanities and languages: EBacc Points, VA Est and VA Score |
| Other Measures | Y or N, or a count, for the KS4 results measures, such as Achieving 5 Standard Passes inc EM |
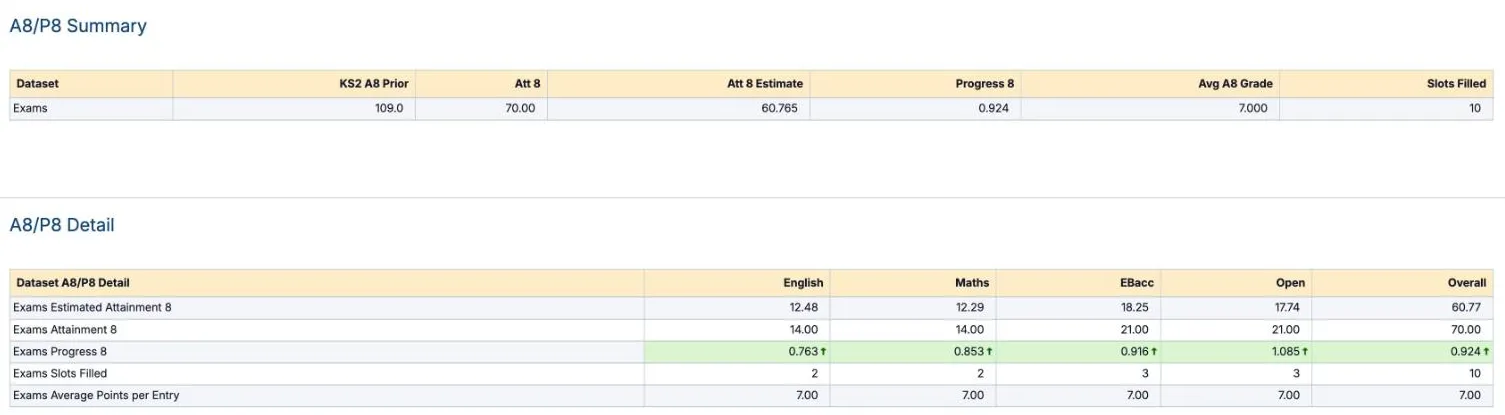
In the 25/26 leavers’ results, Barraclough; Abbie’s KS2 A8 Prior is 109.0 and her Att 8 70.00, against an estimate of 60.765. Her Progress 8 is (70.00 − 60.765) ÷ 10 = 0.924, rounded up from 0.9235. Her average points per entry is 70.00 ÷ 10 = 7.00.
In A8/P8 Detail, her English slots hold 14.00 points against an estimate of 12.48. Her English Progress 8 is (14.00 − 12.48) ÷ 2 = 0.76. The report shows 0.763, from the unrounded estimate. In Value Added, her science score is 7.00 − 6.06 = 0.94, shown as 0.944.
Points to watch
Section titled “Points to watch”Attainment 8 Qualifications lists the qualifications that do not count at the bottom, with N/A in Basket. A qualification can be N/A because it was discounted, or because higher grades filled every slot it could use.
The two reports read the grades differently. Headlines uses first entries after discounting, as the DfE does. The Overview uses every grade, including discounted ones.
The DfE’s secondary accountability guidance (updated October 2025) says schools should not share individual pupils’ progress scores with pupils or parents. See Do not predict or share pupil-level Progress 8.