


 Sonar Tracker
KS5 reports
Best 3 A Levels and Eng/Mat Progress reports
Best 3 A Levels shows the grades behind the DfE’s best 3 A levels measure, student by student. Eng/Mat Progress shows the English and maths progress measures. They cover students who did not get grade 4 or above in GCSE English or maths by the end of KS4. Both take a figure from the Headlines report in Sisra Analytics down to the students who make it up.
Where to find them: select Best 3 A Levels or Eng/Mat Progress under STANDARD REPORTS, or on the REPORTS bar of any report. See Open the KS5 reports.
Who can see them: authority groups with View EAP KS5 Reports and View Headline Report, which Admin and User have by default.
Both need a data set published with Produce DfE-based Headlines figures on. Eng/Mat Progress also needs the students’ Prior English (Challenge Points) and Prior Maths (Challenge Points) baselines. Your administrator imports them: see Set up KS5 baselines and EAPs.
The worked examples use the demo school’s 26/27 cohort, this year’s year 13, and its Y12 Spring collection of predicted grades.
Best 3 A Levels
Section titled “Best 3 A Levels”The measure adds up the points of each student’s three best A level grades. A student’s average is that total divided by 3, even if they fill fewer than three slots. The figure for everyone is the total for all students divided by three times the number of students. Best 3 A levels explains who is included.
Options
Section titled “Options”| Option | What it does | Default |
|---|---|---|
| GROUP REPORT DATA BY | Groups or Students | Students |
| UPDATE STUDENT INCLUSION | Shows only the students included in the measure | Every student |
| ADD FILTER, Grade Measures tab | Narrows the report to grades included in, or left out of, Grades Included in Best 3 A Levels | None |
| BREAKDOWN DATA BY | Splits each row by the values of a filter. Not available at Groups | None |
KS5 report tools and options describes each one.
Read the report
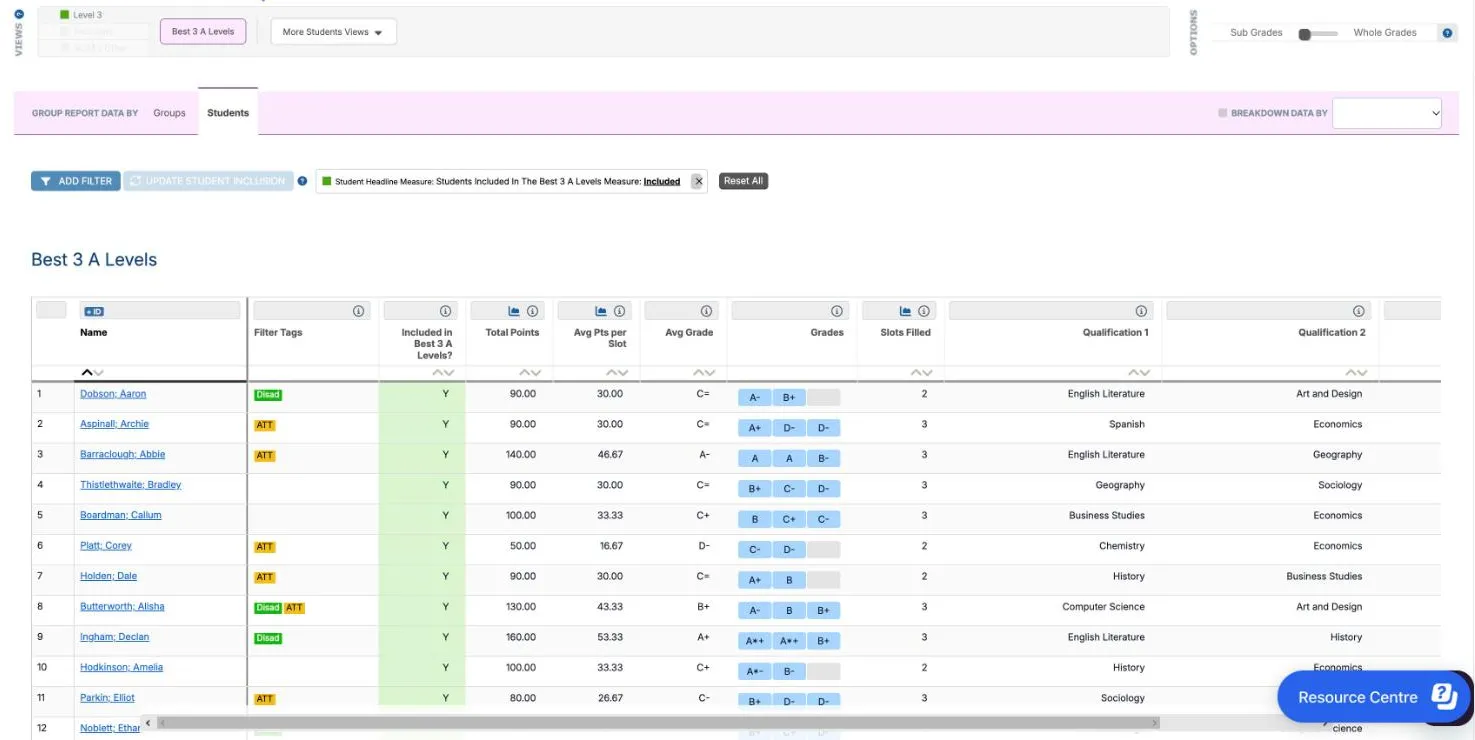
Section titled “Read the report”At Students, each row is one student:
| Column | What it shows |
|---|---|
| Included in Best 3 A Levels? | Y, in light green, if the student counts in the measure under the DfE’s rules |
| Total Points | The points of the grades in the student’s three best A level slots |
| Avg Pts per Slot | Total Points ÷ 3 |
| Avg Grade | That average as a grade |
| Grades | The grade in each slot, in a blue box. An empty slot is grey |
| Slots Filled | How many slots the student fills, up to 3 |
| Qualification 1, Qualification 2, Qualification 3 | The qualification in each slot, best first |
At Groups, each row is one filter value. Its columns are Student Count, Students included in Best 3 A Levels, Average Total Points, Avg Pts per Slot, Avg Grade and Average Slots Filled.
In the demo school’s predictions, after UPDATE STUDENT INCLUSION:
- Barraclough; Abbie has A, A and B- in English literature, geography and Spanish. That is 50 + 50 + 40 = 140 points, and 140 ÷ 3 = 46.67, an A-
- Dobson; Aaron has two A levels, at A- and B+, so his third slot is empty. That is 50 + 40 = 90 points, and 90 ÷ 3 = 30.00, a C=
- across the 158 students, Average Total Points is 90.38 and Avg Pts per Slot 30.13, a C=, with 2.73 slots filled on average
The +, = and - on a predicted grade make no difference to its points: Dobson; Aaron’s A- is worth 50 and his B+ 40. He still counts in the measure with two A levels, because his third qualification is smaller than an A level.
Points to watch
Section titled “Points to watch”Select UPDATE STUDENT INCLUSION before you quote a summary figure. Until you do, the report includes students the measure leaves out. In the demo school, the summary then shows 86.80 average total points, against 90.38 in Headlines.
AS levels, General Studies and Critical Thinking do not fill slots, and a double award A level fills two. If two grades tie for the third slot, only one of them counts.
Dividing by 3 for every student lowers the figure for students with fewer than three A levels, as in the DfE’s measure. A low average can mean a student took two A levels, not that their grades were low: check Slots Filled.
The AAB measures, in Headlines, use the same students. To list the students achieving one, select its figure in Headlines, or use the AAB section of the Student Measures tab in ADD FILTER. In the demo school’s predictions, the 11 students achieving AAB with at least two facilitating subjects average 49.39 points per entry, an A=.
Eng/Mat Progress
Section titled “Eng/Mat Progress”The measures cover students whose prior English or maths, from KS4, is worth less than 4 challenge points: below grade 4 at GCSE. A student’s progress is the challenge points of their best grade in the sixth form, minus their prior points. Any score below −1 counts as −1. English and maths progress explains the measures.
Options
Section titled “Options”| Option | What it does | Default |
|---|---|---|
| The view | English Progress or Maths Progress | English Progress in the demo school. Your administrator can choose the other in KS5 Report Settings |
| GROUP REPORT DATA BY | Groups or Students | Students |
| UPDATE STUDENT INCLUSION | Shows only the students included in the measure | Every student |
| BREAKDOWN DATA BY | Splits each row by the values of a filter. Not available at Groups | None |
The report opens at the GCSE / Other performance level, where GCSE resits sit.
Read the report
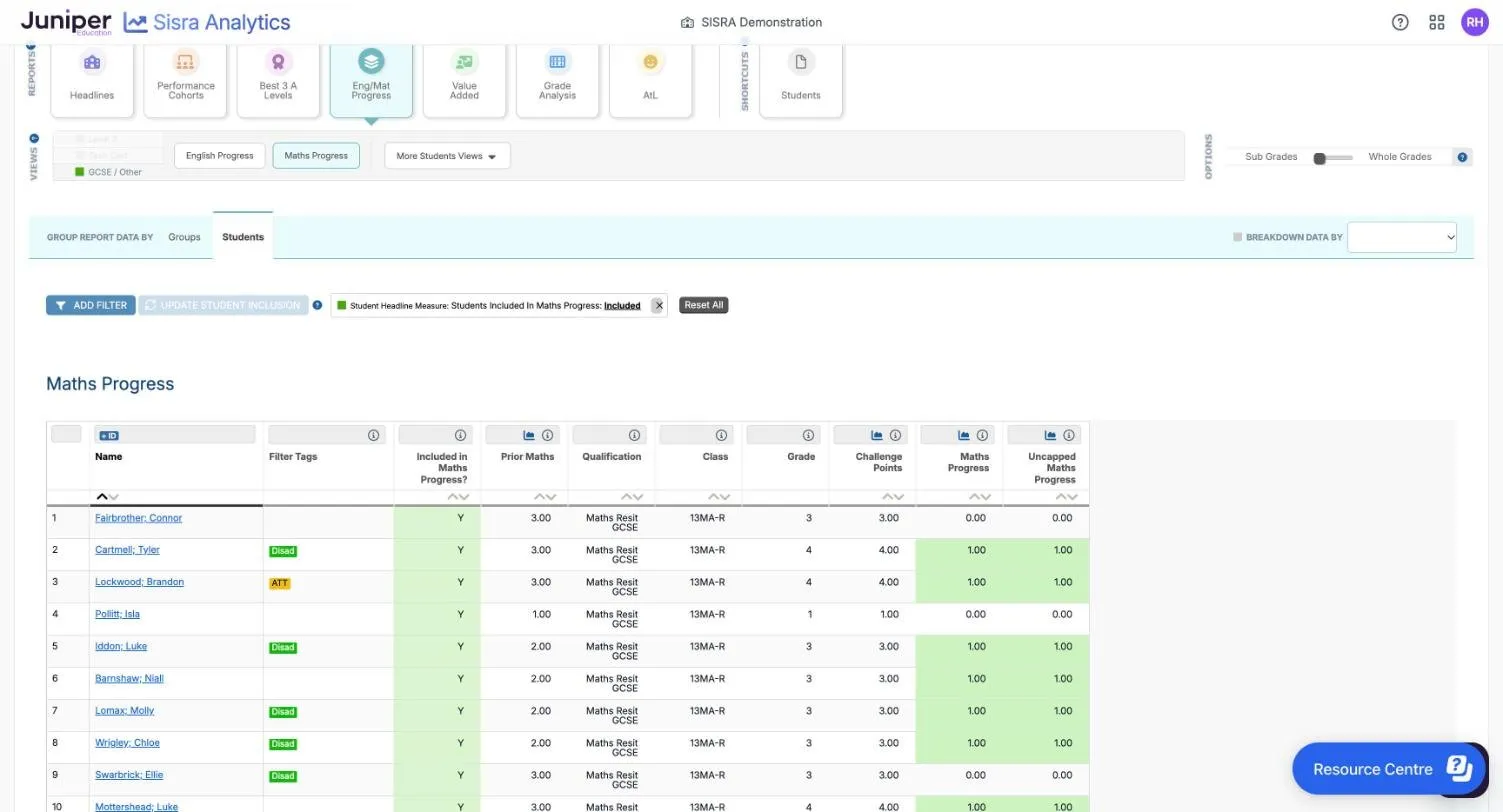
Section titled “Read the report”At Students, the Maths Progress view has these columns. English Progress has the same for English.
| Column | What it shows |
|---|---|
| Included in Maths Progress? | Y if the student is in the measure |
| Prior Maths | The challenge points of the student’s KS4 maths result, imported by your administrator |
| Qualification | The maths resit qualification the student takes in the sixth form |
| Class | Their class for it |
| Grade | Their best grade in a maths resit qualification |
| Challenge Points | That grade’s challenge points. A GCSE grade’s challenge points equal the grade, so a grade 4 is worth 4 |
| Maths Progress | Challenge Points minus Prior Maths, with any score below −1 counted as −1. Students in the measure with no grade still get a score. Shaded green above 0 |
| Uncapped Maths Progress | The same without the cap, for internal use |
At Groups, English Progress gives each filter value’s Student Count and Students Included in English Progress. It then gives Avg Prior English, Avg Challenge Points, Avg English Progress and Avg Uncapped English Progress.
In the demo school’s predictions, after UPDATE STUDENT INCLUSION, 15 students are in Maths Progress. All of them take Maths Resit GCSE in class 13MA-R:
- Cartmell; Tyler has Prior Maths of 3.00 and is predicted a 4: 4.00 − 3.00 = 1.00
- Fairbrother; Connor has 3.00 and is predicted a 3: 0.00
- Pollitt; Isla has 1.00 and is predicted a 1: 0.00
The summary row averages 2.40 prior points and 3.13 challenge points. So average progress is 3.13 − 2.40 = 0.73, as in Headlines. No student is below −1, so the capped and uncapped averages are both 0.73.
Points to watch
Section titled “Points to watch”Select UPDATE STUDENT INCLUSION before you quote a summary figure. In the demo school, the Maths Progress summary shows 3.73 until you do, against 0.73 in Headlines. Students outside the measure who have maths grades are averaged in.
A student whose prior result is worth exactly 4 is not in the progress measure. Students with prior maths worth 4 or more count in the level 3 maths measure instead. It has no view of its own, and its figures are in Headlines. To list its students, use Students Included in the L3 Maths measure on the Student Measures tab of ADD FILTER.
A student in the measure without a grade scores 0 minus their prior points, capped at −1. In the demo school’s 25/26 leavers’ Exams, the resit qualifications have no grades. So every student in each measure scores −1, and Average English Progress and Average Maths Progress are both −1.00.
In its 16 to 19 consultation (April to July 2026), the DfE proposed moving the cap from −1 to −2. Its response was still awaited on 15 October 2026, so Sisra uses −1.