


 Sonar Tracker
Baselines and EAPs
Create custom Attainment 8 estimates
Progress 8 compares each pupil’s Attainment 8 (A8) score with an estimate: the average A8 score of pupils nationally with the same KS2 prior attainment. Sisra Analytics offers three kinds of estimates when you publish grades: the DfE’s official estimates, Sisra Data Collaboration estimates, and custom estimates that your school makes. This page covers custom estimates.
The DfE’s guidance now calls these figures Attainment 8 averages. Sisra, like most schools, calls them estimates.
Decide whether you need them
Section titled “Decide whether you need them”Most schools publish with official or Data Collaboration estimates. Custom estimates help in two cases:
- You want no Progress 8 scores in a report. A custom set with no values produces none, which avoids figures that would mislead staff.
- You want to model Progress 8 on your own assumptions, such as estimates half a grade higher than last year’s. Copy a set of official or collaborative estimates, then change the values.
Custom estimates have limits:
- Progress 8 calculated with them is your school’s figure, not the DfE’s. Say so wherever you share it.
- They have no lower limit. Official DfE estimates from 2018 onwards replace very low Progress 8 scores with a minimum for each prior attainment group (adjusted Progress 8). Custom estimates never do.
- Their baseline type must match the cohort’s KS2 baseline type, or Sisra will not calculate Progress 8.
- They cannot give Progress 8 to pupils without a KS2 score. Those pupils stay out of Progress 8, whatever the estimates.
- They apply to A8 Estimates: only. VA Estimates: offers official and Data Collaboration sets.
The DfE warns against reading too much into models like these. Its secondary accountability guidance (GOV.UK, updated 16 October 2025) says that “any modelling based on current national results can be misleading”.
Before you start
Section titled “Before you start”You need an authority group with Access Data Section, such as Admin. Know the cohort’s KS2 baseline type: Scaled Scores for every cohort from 20/21, and NC fine levels before that. Upload KS2 baselines explains baseline types.
Create a set of estimates
Section titled “Create a set of estimates”- Open the KS3/4 cohort in DATA.
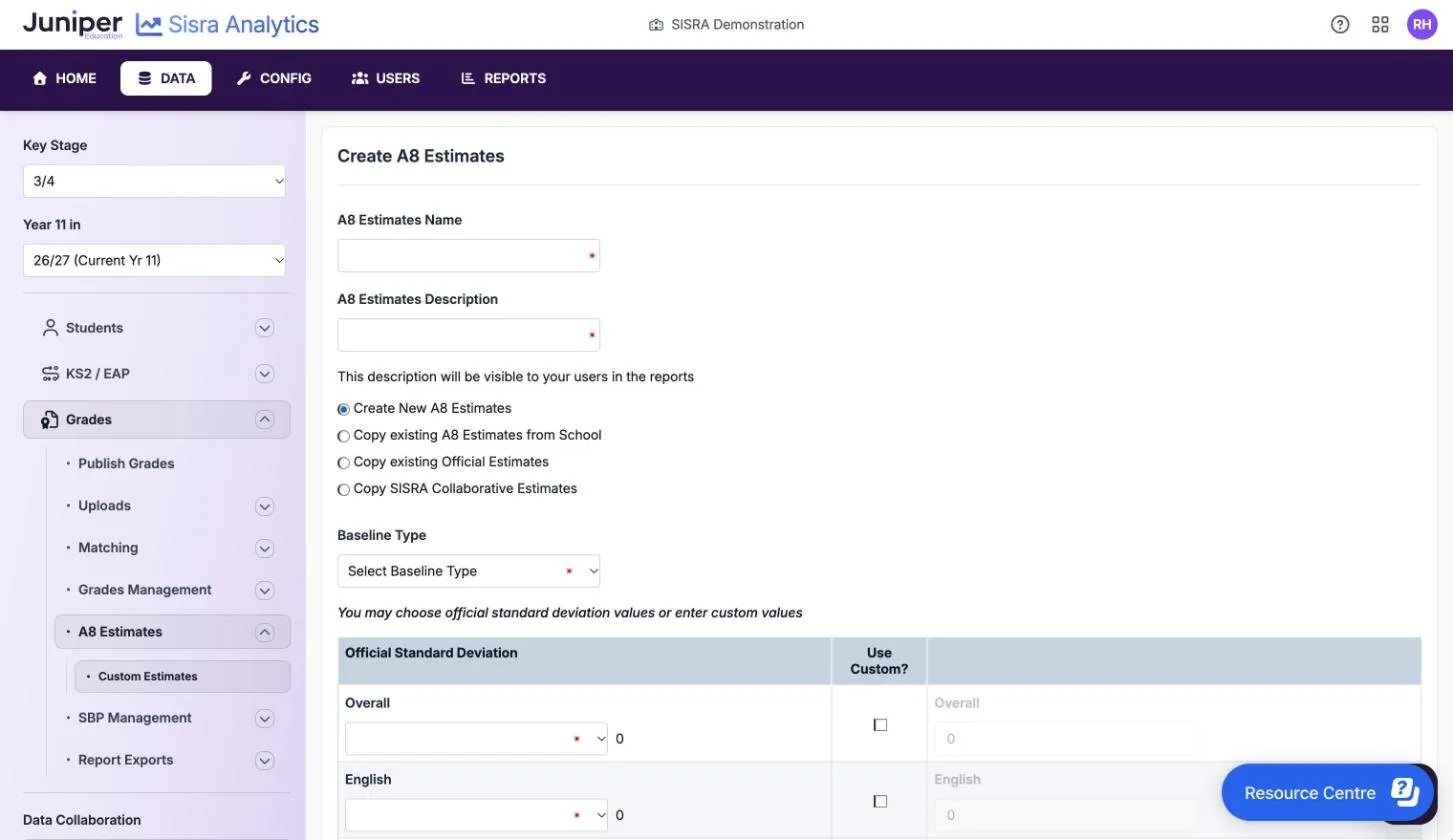
- Select Grades, then A8 Estimates, then Custom Estimates.
- Select Create A8 Estimates.
- Enter an A8 Estimates Name and an A8 Estimates Description. Both are required.
- Choose how to start, from the four options in the next table, and make the choices it lists.
- Select Create.
The name appears in the publish dialog and in reports that use the estimates. The description is “visible to your users in the reports”, so say what the estimates are, such as 2024 DfE estimates raised by half a grade.
| Option | What you get | Then choose |
|---|---|---|
| Create New A8 Estimates | An empty set | The Baseline Type, and the standard deviations as in Set the standard deviations |
| Copy existing A8 Estimates from School | A copy of a custom set from this or another cohort | The Baseline Type, then the cohort and the set |
| Copy existing Official Estimates | The DfE’s estimates for a year | The year |
| Copy SISRA Collaborative Estimates | The Data Collaboration estimates and standard deviations for a year | The year |
A8 Estimates Detail opens. It is empty for a new set and filled in for a copy.
Set the standard deviations
Section titled “Set the standard deviations”For each of Overall, English, Maths, EBacc and Open, choose a year’s Official Standard Deviation, from 2024 back to 2014. To use your own value, tick Use Custom? and enter it.
The standard deviations set the width of the confidence intervals Sisra shows around Progress 8 and its four element scores. Each uses its own standard deviation. The interval is 1.96 × the standard deviation ÷ the square root of the number of pupils included. With a standard deviation of 1.3 and 100 pupils, it is 1.96 × 1.3 ÷ 10 = 0.25. A school Progress 8 score of 0.20 would then have limits of −0.05 and 0.45.
Enter or change the estimates
Section titled “Enter or change the estimates”To change one value, select the pencil next to its KS2 baseline in A8 Estimates Detail, enter the estimates and save.
To change many, use Excel:
- Select Export A8 Estimates.
- Change the values in Excel, keeping the rows and columns as they are.
- Save the file as CSV (MS-DOS).
- Select Import A8 Estimates, choose the file and select Import.
- Read the check, then select Import again.
| Message | What to do |
|---|---|
| “X row(s) have conflicts within the imported file” | A baseline is on more than one row. Keep one row for each and import again. |
| “X row(s) have an invalid baseline A8 Estimate and will be excluded from the import” | A row’s baseline does not match the set’s baseline type, such as a fine level in a Scaled Scores set. Carry on if you do not need the row, or export again to get the right rows. |
X is the number of rows affected. Each value can be up to 12 characters and no larger than 99999.
To stop a report showing Progress 8, leave every estimate blank and publish with the set.
Publish with custom estimates
Section titled “Publish with custom estimates”- Select Grades, then Publish Grades.
- Select Publish on the data set, or on the slot for an assessment collection.
- On the Publishing tab, turn on Headlines.
- In A8 Estimates:, choose your set under Custom Estimates:.
- Choose VA Estimates: as usual.
- Select Publish.
Choose the publishing options explains the other options. If the set’s baseline type does not match the cohort’s, an icon appears next to it. Its message says this “will result in issues for related figures in reports”, and Progress 8 is not calculated.
How Progress 8 uses the estimates
Section titled “How Progress 8 uses the estimates”Each pupil’s Progress 8 score is their A8 score minus their estimate, divided by 10. Sisra finds the estimate from the average of the pupil’s KS2 reading and maths scores.
Two fictional pupils both have a KS2 average of 104.5, and the custom estimate for 104.5 is 50.00:
| Pupil | A8 score | Progress 8 |
|---|---|---|
| Lena Park | 56.00 | (56.00 − 50.00) ÷ 10 = 0.60 |
| Omar Reid | 4.00 | (4.00 − 50.00) ÷ 10 = −4.60 |
Their average is (0.60 − 4.60) ÷ 2 = −2.00. Official DfE estimates from 2018 onwards raise any score below the DfE’s minimum for the pupil’s prior attainment group to that minimum. With custom estimates Omar’s score stays at −4.60, so one very low score pulls a small group’s average down further.
If something goes wrong
Section titled “If something goes wrong”Progress 8 is blank. Check that the set’s baseline type matches the cohort’s, that the set has values for your pupils’ KS2 averages, and that the cohort has KS2 baselines. Then republish.
Pupils with KS2 results have no Progress 8. A pupil with no scoring KS2 result, such as letter codes in both subjects, has no KS2 average, so Sisra leaves them out.
The set is not in the publish dialog. Turn on Headlines first: the estimates lists appear under Headlines/SBP Options.