


 Sonar Tracker
How Sisra works
EAPs, flight paths and on track
An Expected Attainment Pathway (EAP) records your school’s expectations: for each starting point, the grade you expect at each term of a course. Sisra Analytics compares grades with these expectations to show on track, draw flight paths and project grades. The expectations are your school’s own, not forecasts, and the last section sets out what research says about using them.
What an EAP holds
Section titled “What an EAP holds”Every qualification needs an EAP, chosen on the Matching page, even if you never enter expected grades. The EAP sets the qualification’s grade method, term by term at KS3/4, so that Sisra knows which grades and points to expect. Qualifications graded in different ways, such as GCSE 9 to 1, combined science and a BTEC, need separate EAPs.
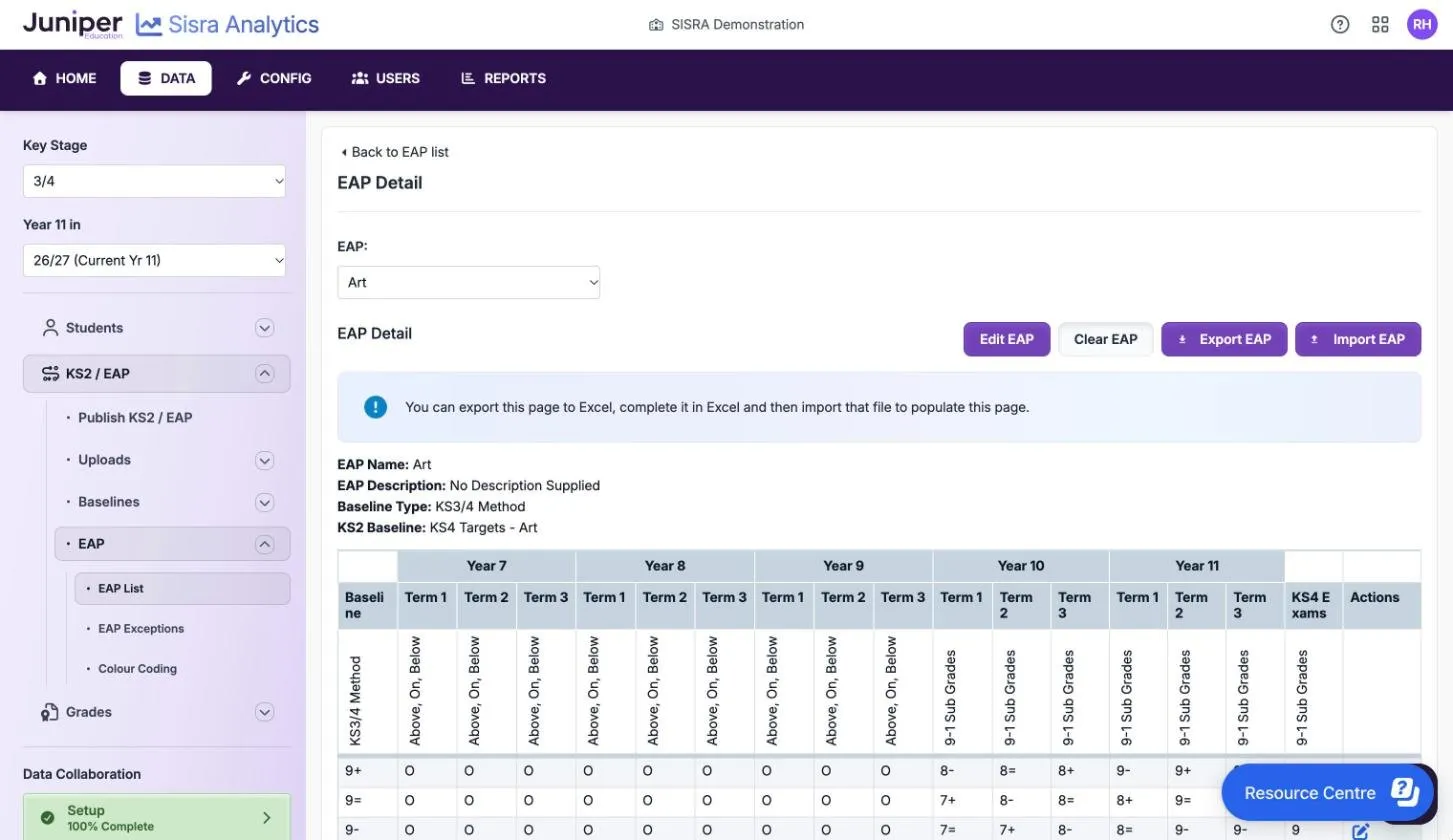
An EAP can also hold expected grades, laid out as a grid:
- each row is a pathway for one baseline value, such as a target of 7 or a KS2 scaled score of 105
- each column is a term, from year 7 term 1 to the KS4 exams (year 12 term 1 to the KS5 exams at KS5)
- each cell is the grade you expect by that term on that pathway
Everyone with the same baseline value shares a pathway, and you need fill in only the pathways your pupils or students use. Without expected grades, on track, flight paths and projections stay empty. Set up EAPs for KS3/4 and Set up KS5 baselines and EAPs give the steps.
Baselines
Section titled “Baselines”The baseline places each pupil or student on a pathway. It can be the KS2 results used for Progress 8, but it need not be:
| Baseline | Example |
|---|---|
| Target grades | Each pupil’s KS4 target in art, so that every pupil targeted 7 shares a pathway |
| KS2 scaled scores | KS2 maths scores for a maths EAP, or a baseline group that averages reading and maths |
| Standardised test scores | Scores from a test such as the Cognitive Abilities Test (CAT), entered as a number range |
| A number for each pupil | A different number from 0 to 300 for everyone, so that each has their own pathway |
At KS5 the baseline is a grade in a KS5 grade method, such as a target, or a number from 0 to 300.
Pathway shapes
Section titled “Pathway shapes”Pathways come in two shapes, and each suits a different kind of grade.
| Shape | What it looks like | Suits |
|---|---|---|
| Flat line | The same expected grade every term, usually the target: 8 in every term for a target of 8 | Predicted grades, because a prediction is an end-of-course grade you can compare with the target |
| Rising line | Expected grades climb towards the target: for a target of 8, 7= in year 11 term 1, then 7+ in term 2 | Working-at grades, which should rise as the course goes on |
Match the shape to the grades. Working-at grades compared with a flat line of targets put most pupils below track early in a course, which says nothing about their progress. Predictions compared with a rising line make pupils look above track in the early terms. Data sets, assessment collections and grade types explains the kinds of grade.
On, above and below track
Section titled “On, above and below track”On track compares each grade with the expected grade on the pupil’s own pathway, for the term of the data set or collection:
- above track means the grade is higher than expected
- on track means it is the same
- below track means it is lower
For example, Mia Strand’s art target is 7 and her pathway rises to 6= by year 10 term 3. In the year 10 summer collection she has 5-, so she is below track. Kit Ferrier is targeted 6 on a flat line and predicted 7- in the same collection, so he is above track.
Sub-grades matter. With Sub, a 5- against an expected 5+ is below track. With Whole, Sisra compares whole grades only, so the same grade is on track. An administrator sets the default for the school, and staff can switch between Sub and Whole on a report’s toolbar.
On track uses each pupil’s best grade in a qualification, not their first entry, so it can differ from the headline figures. Pupils and students without an EAP baseline are left out. Inc In Track in the reports shows how many are included.
Colour coding
Section titled “Colour coding”EAP colour coding marks each grade in student-level reports as above, on or below the expected grade. Grades reports gives the colours. It is on for every data set unless an administrator turns it off, and it shows only when you:
- view a single data set at student level, as a list or for one pupil or student
- are not using Compare or the Tracker
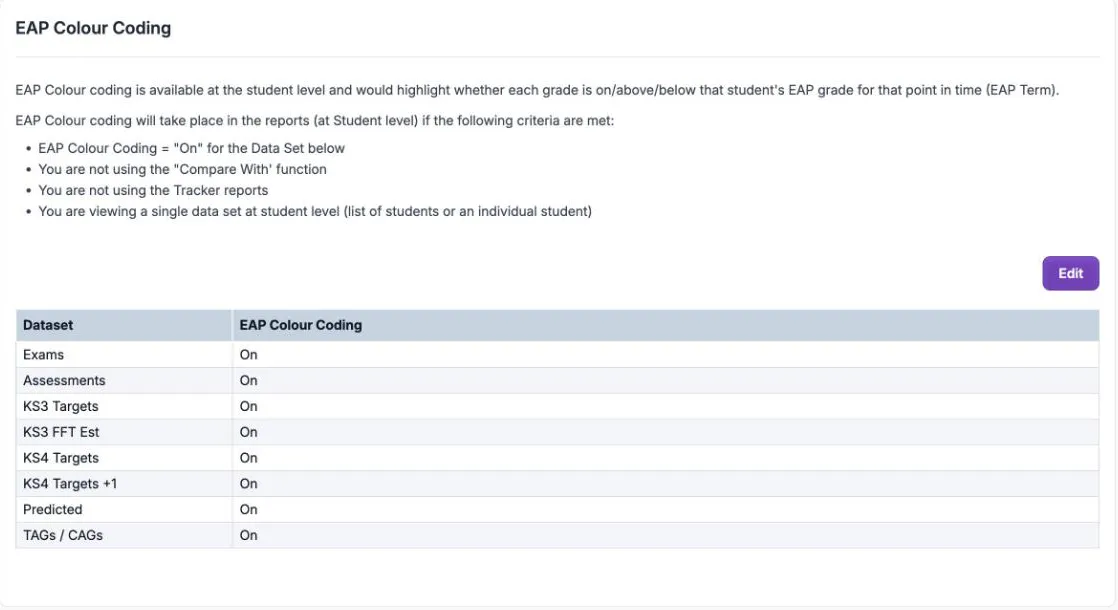
Turn colour coding off for a data set whose grades do not suit its EAP, such as predictions compared with working-at expectations. At KS3/4 it is under KS2 / EAP > EAP > Colour Coding, and at KS5 under KS4 / EAP > EAP / Baselines > Colour Coding.
Exceptions
Section titled “Exceptions”An EAP exception gives one pupil or student different expected grades from others with the same baseline. For example, a pupil who speaks Spanish at home might have higher expectations in GCSE Spanish. Use exceptions for a few pupils only. If most pupils need their own pathway, a different number for each pupil as the baseline is a better fit. An exception works only for a pupil who has an EAP baseline.
Flight paths
Section titled “Flight paths”A flight path is a chart for one pupil and one qualification, at KS3/4. It plots the pupil’s grades term by term as a solid line, against the EAP’s expectations as a dotted line. Staff see flight paths in the Student Detail Overview report once an administrator has generated them from published collections.
| Chart | The dotted line | Suits |
|---|---|---|
| Plotted Expectation | Each term’s expected grade from the EAP, so it can rise and fall | One grade method from year 7 to year 11 |
| Line of Best Fit | A straight line from the first expectation to the final one | Different grade methods in KS3 and KS4, such as an above, on and below method in KS3, then GCSE 9 to 1 |
The chart places each grade by its rank in the grade method, not by its points, so that the line climbs towards the KS4 exams. The starting point can be the pupil’s official KS2 result or their EAP baseline. This changes only where the line starts, not the pathway. Generate the tracker and flight paths and Student Detail reports explain how to make and read them.
Sisra Basic Projections
Section titled “Sisra Basic Projections”Sisra Basic Projections (SBP) use your EAPs to project each KS3/4 grade to the end of KS4. For each grade, SBP finds the pathway that expects that grade in the current term, and takes that pathway’s grade for the KS4 exams. It then works out every headline measure again from the projected grades.
| Pathway | Year 10 term 1 | KS4 exams |
|---|---|---|
| Target 5 | 4= | 5 |
| Target 7 | 5= | 7 |
A pupil targeted 7 and working at 5= in year 10 term 1 is on track, so SBP projects a 7. Another pupil targeted 7 but working at 4= projects to a 5. That is because 4= is what the pathway for a target of 5 expects at that point.
SBP needs expected grades for the KS4 exams term, and it does not work on data sets in that term. An administrator turns it on with SISRA Basic Projections (SBP) when publishing. Staff then choose P beside the data set in the Main Focus list, on a report’s Dataset tab. SBP Management sets how many KS4 grades a KS3 subject projects into, such as two for KS3 science taught towards combined science.
A projection assumes that each pupil stays on the pathway their current grade sits on. Juniper Education does not intend SBP as an accurate forecast of a cohort’s results: use it to choose where to look early. Good practice with school data explains why forecasts need care.
What the evidence says about flight paths
Section titled “What the evidence says about flight paths”In 2018 the DfE’s Teacher Workload Advisory Group found that “‘flight paths’ for pupils with similar starting points are not valid”. Its report, ‘Making data work’, says they understate how differently pupils progress. The government accepted all its recommendations.
FFT Education Datalab followed pupils through KS2, KS3 and KS4. Only about 9% kept to the expected path, and 33% made “expected progress” from KS3 to KS4 (Treadaway, 5 March 2015). Mike Treadaway wrote that “more children get to the ‘right’ place in the ‘wrong’ way”. He recommends target ranges rather than single grades, and no rewards or sanctions tied to expected progress.
Sarah Hannafin of the National Association of Head Teachers made the same point (Teachwire, 1 March 2017). Pupils, she wrote, “will rarely, if ever, make progress over time in a nice straight line”. A pupil below the line should prompt questions, not automatic intervention.
So read an EAP as a statement of what your school expects, not a forecast of what each pupil will get. Being below a pathway is a reason to look at a pupil’s work and talk to their teachers. It is not a verdict on the pupil or the teacher. Good practice with school data covers targets and ranges.