


 Sonar Tracker
Set up your school
Set up student data columns and filters
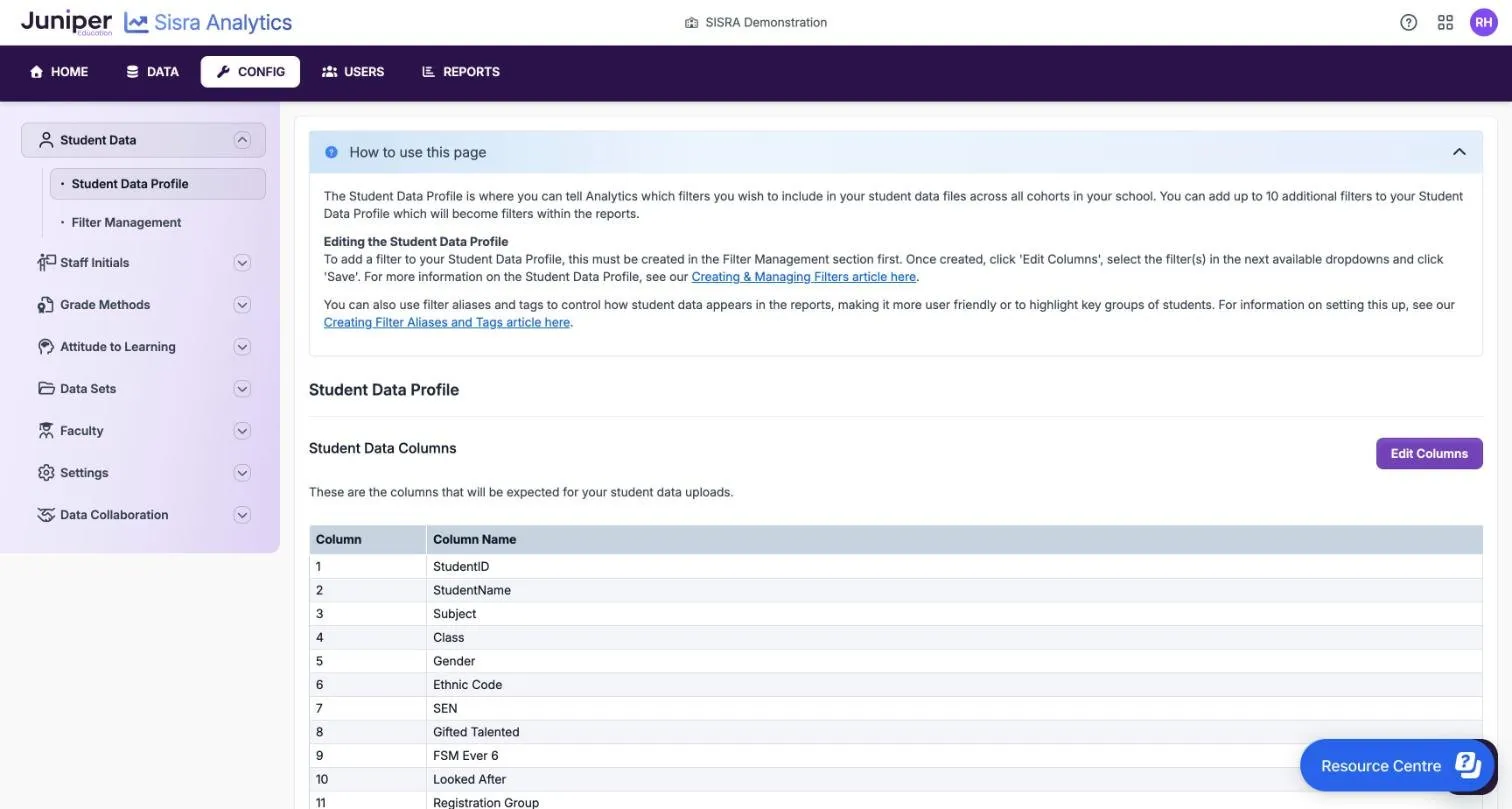
The Student Data Profile lists the columns Sisra Analytics expects in every student data file, for every cohort at KS3/4 and KS5. From column 5 on, each column is a filter, such as SEN or Disadvantaged. Staff use filters to look at groups of pupils and students in the reports. You manage the profile and the filters in CONFIG.
Before you start
Section titled “Before you start”You need:
- an authority group with Access Data Section, such as Admin
- to have agreed with senior leaders which characteristics the reports should show
Authority groups and permissions explains Access Data Section. While anything is waiting in the publishing queue, CONFIG is locked for the whole school.
Check the columns in the profile
Section titled “Check the columns in the profile”- Select CONFIG.
- Select Student Data, then Student Data Profile.
The Student Data Columns table lists up to 20 columns. Sisra expects every student data file to contain all of them.
| Columns | What they are | Can you change them |
|---|---|---|
| 1 to 4 | StudentID, StudentName, Subject and Class. Subject is the set of classes, such as English, and Class is the teaching group | No |
| 5 to 10 | Sisra’s default filters: Gender, Ethnic Code, SEN, Gifted Talented, FSM Ever 6 and Looked After | No. They stay in the profile even if you do not use them |
| 11 to 20 | Up to 10 filters of your own, such as Registration Group, Disadvantaged or EAL | Yes, with Edit Columns |
One profile serves every cohort, from year 7 to year 13. Include every column in each file, even a default filter you do not use. Leave that column’s cells blank and Sisra fills them with the filter’s default value. If a file has no column for a filter, choose ** USE DEFAULT VALUE ** for it when you import. The order of the columns does not matter, and Sisra ignores any extra columns.
Each pupil or student has one value for each filter, the same on every row of the file. So a filter cannot hold something that changes from class to class, such as the class teacher.
Disadvantaged and EAL are not default filters, so create them if you need them. Key filter mapping needs a filter that matches the DfE’s definition of disadvantaged. FSM Ever 6 does not, because it leaves out looked-after and previously looked-after pupils.
Create a filter
Section titled “Create a filter”- In CONFIG, select Student Data, then Filter Management.
- Select Create Filter.
- In Filter Name:, enter the name the reports will show, such as
House. - In Default Value:, enter the value Sisra gives anyone whose cell is blank, such as
N/A. - Select Create.
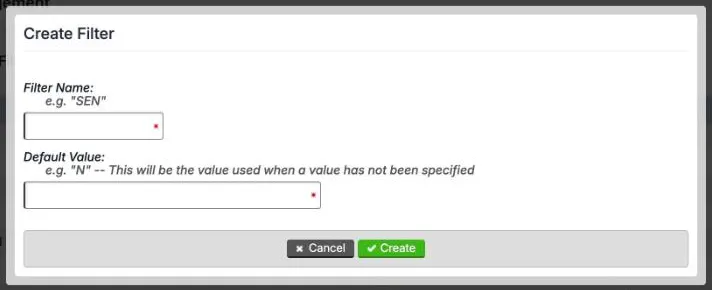
The filter joins the Student Data Filters list, marked ”- User Created”. It does nothing until you add it to the profile. Avoid commas in filter names and values, because they can stop a .csv file importing.
Add a filter to the profile
Section titled “Add a filter to the profile”- In Student Data Profile, select Edit Columns.
- In the first free drop-down from column 11 to column 20, choose the filter. Each drop-down offers None and every filter you have created.
- Select Save.
Sisra shows “Student data defaults successfully updated”. The Upload Format Example at the foot of the page changes to match. Next, add the column to the report or export you use in your MIS. Then import student data for each cohort.
To take one of your filters out of the profile, set its column to None. Files then no longer need that column. If any cohort maps the filter to a key filter, Sisra clears that mapping. To hide a filter from one cohort’s reports instead, use Show Filters: see Choose where each filter appears.
Edit or delete a filter
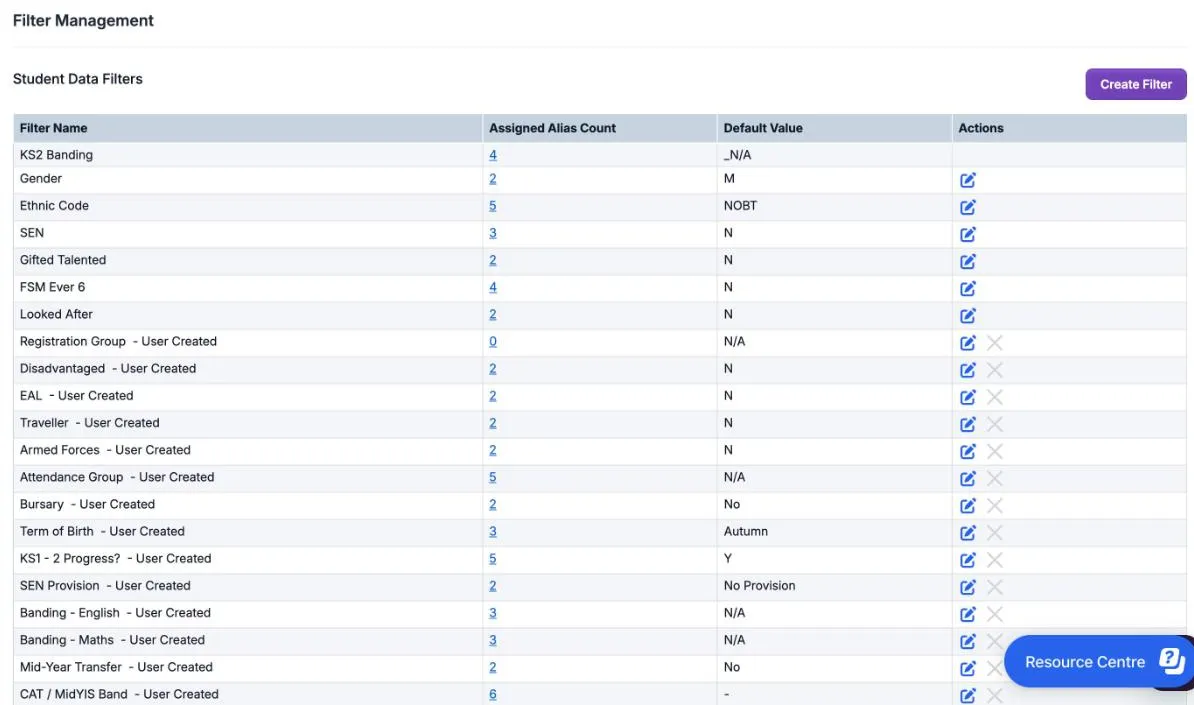
Section titled “Edit or delete a filter”Filter Management lists each filter with its Assigned Alias Count, its Default Value and Actions.
- To change a filter’s default value, select the pencil in Actions. The row turns into boxes. Change the value, then select Submit. For a filter you created, you can change its name in the same way.
- To delete a filter you created, select the cross in Actions. You can delete a filter only when it is not in use. Until then the cross is greyed out.
The default filters have a pencil but no cross. KS2 Banding has no actions, because Sisra works it out from each pupil’s KS2 core subjects. See Upload KS2 baselines.
Rename filter values with aliases
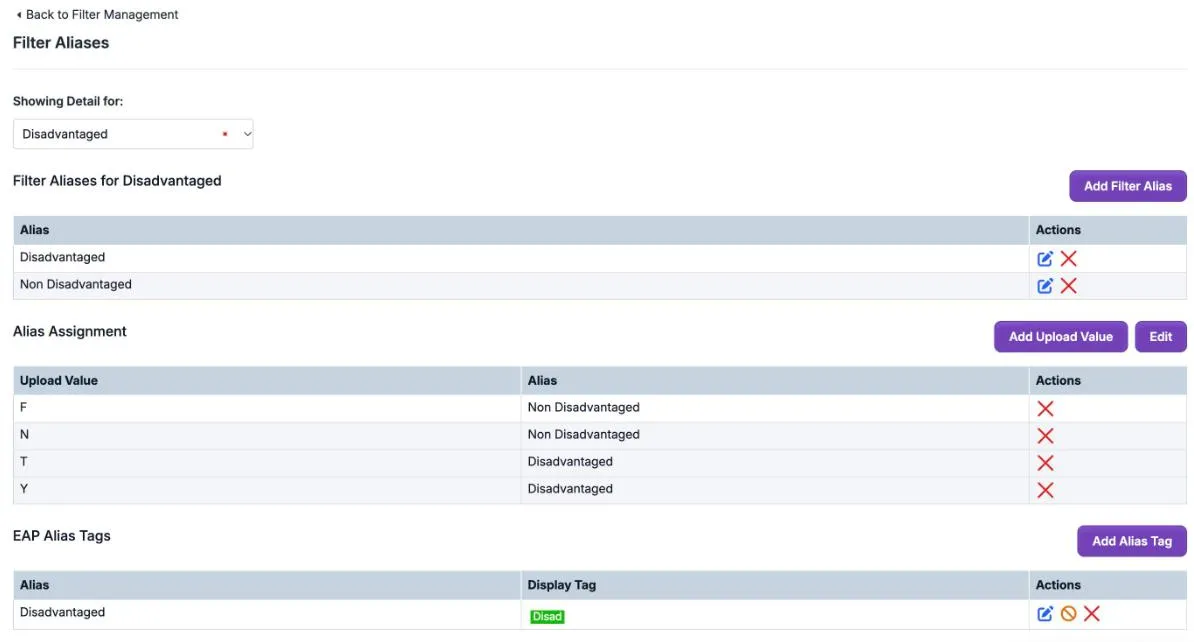
Section titled “Rename filter values with aliases”An alias is the name the reports show for a value in your files. Several values can share one alias. In the demo school, the Disadvantaged filter’s values F and N show as Non Disadvantaged, and T and Y show as Disadvantaged.
- In Filter Management, select the number in the filter’s Assigned Alias Count column. The Filter Aliases page opens.
- Select Add Filter Alias, enter the alias, then select Create. Repeat for each alias.
- Under Alias Assignment, select Add Upload Value.
- Enter the value as it appears in your files in New Upload Value, choose its Alias, then select Create. Repeat for each value.
- Publish student data for each cohort.
Showing Detail for: switches to another filter. To move several values to new aliases at once, select Edit under Alias Assignment, choose from the drop-downs, then select Save Changes.
Highlight groups with tags
Section titled “Highlight groups with tags”A tag is a coloured label of up to 5 characters that appears next to names in the reports, such as Disad. Tag only the groups you focus on, such as disadvantaged pupils, and not everyone else.
- On the filter’s Filter Aliases page, under EAP Alias Tags, select Add Alias Tag.
- Choose the alias.
- Enter the Display Tag, such as
PP. - Choose a colour from the colour wheel. Preview: shows how the tag will look.
- Select Submit.
- Publish student data for each cohort. For a tag on KS2 Banding, publish KS2 / EAP as well.
For KS2 Banding, the tag table is headed KS3/4 Alias Tags instead of EAP Alias Tags.

Make attendance bands into a filter
Section titled “Make attendance bands into a filter”Sisra has no attendance setting of its own, so record attendance as a filter of bands. The demo school’s Attendance Group filter has 5 aliases. First create the filter, with a default such as N/A, and add it to the profile. Then fill it in one of two ways.
Put the band in the file. Before each import, add a column to your export with each person’s band, such as 84% or Below, 85 to 95% or 96% or Above. Map that column to the filter when you import.
Let aliases make the bands. Do this once for the school:
- On the filter’s Filter Aliases page, add an alias for each band.
- Add each whole percentage from 0 to 100 as an upload value, assigned to its band’s alias.
- Before each import, round the attendance column to whole numbers, for example with the ROUND function in Excel.
Do not import percentages with decimals. They slow publishing and the reports, and each decimal would need its own alias. Avoid band names with a < followed by a letter, such as 90<x<95, because security systems can flag them. Write 90 to 95%, <90% or >95% instead.
To bring the bands up to date, import a new file with Update Filters: set to Yes, then publish student data.
Publish student data after changes
Section titled “Publish student data after changes”Reports show filters, aliases and tags as they were when each cohort’s student data was last published.
| You changed | Then |
|---|---|
| The profile’s columns | Add the columns to your MIS export, import student data for each cohort, then publish it |
| Aliases or tags | Publish student data for each cohort |
| A tag on KS2 Banding | Publish student data, then KS2 / EAP |
Publish student data gives the steps.
If something goes wrong
Section titled “If something goes wrong”CONFIG is locked. Sisra locks CONFIG while any cohort has data in the publishing queue. Wait for publishing to finish.
The cross next to a filter is greyed out. The filter is in use, so you cannot delete it.
The reports still show the old values. Publish student data for the cohort.
A filter is missing from Filter Breakdown. The filter has more than 15 values in the cohort. Group its values into 15 or fewer with aliases.
An import stops with a filter conflict. Someone has two values for one filter on different rows of the file. Make the values match, then import again. See Read the file health check.