


 Sonar Tracker
KS3/4 reports
Headlines reports
The Headlines area of Sisra Analytics shows a cohort’s headline measures, worked out under the DfE’s rules. They are Attainment 8 (A8), Progress 8 (P8), English and maths, the English Baccalaureate (EBacc) and value added (VA). Its four reports, Summary, Dashboard, Charts and Filters, show the same measures in different ways, for the whole cohort.
Where to find it: open a report with Whole Cohort on the reports home, or select Headlines on the area bar. See Open the KS3/4 reports.
Who can see it: authority groups with View Headline Report, which Admin and User have by default.
The area needs a data set published with Headlines on and a DfE Rules from: year, in grade methods with Attainment 8 points. Otherwise it is greyed out. The figures count only pupils with the status On Roll, and use each pupil’s first entries after discounting, as the DfE does. How Sisra calculates the KS4 measures explains each measure.
The worked examples use the demo school’s 26/27 cohort, this year’s year 11. Its Y10 Summer collection holds predicted grades from the end of year 10. It was published with the DfE’s 2024 Attainment 8 and value added estimates and the 2024 Data Collaboration. Most screenshots show the 25/26 leavers’ Exams. The demo school has KS2 scores for that cohort, but they are not official, so its Progress 8 figures are not the DfE’s.
Progress 8 and the estimates
Section titled “Progress 8 and the estimates”An orange banner appears above the report when the Attainment 8 estimates are not the ones the DfE will use for the cohort. It says that any Progress 8 figures “should be used for internal analyses only and must be treated with great caution”. Current cohorts always get this banner, because the DfE publishes a year’s estimates only after that year’s results. Click here to view the estimates in use opens A8 Estimates Used: see Which estimates the figures use.
Summary
Section titled “Summary”The Summary is a set of tables, one for each group of measures. If the data set was published with Sisra Data Collaboration, the collaboration’s figures sit beside the school’s. It is the report Whole Cohort usually opens.
Options
Section titled “Options”| Option | What it does | Default |
|---|---|---|
| Measures tab | Narrows the report to pupils included in, or left out of, chosen measures | No measures |
| Filters tab | Narrows the report to a group, such as one registration group | No filters |
| Breakdown : | Splits each measure by the values of a filter, with GAP rows for a filter with two values | None |
| Compare | Adds the figures of a second data set, such as targets | None |
| Displaying Collab. Data : | Shows or hides the collaboration columns | Displaying |
| On Track | Narrows the report by track, once you choose a qualification on Options | All |
Report tools and options describes each tab and control.
Read the report
Section titled “Read the report”| Section | What it holds |
|---|---|
| Cohort Summary | Cohort: the pupils on roll, after any filters |
| Attainment/Progress 8 Summary | Average Attainment 8 and average grade, average KS2 prior attainment, the average estimate, Progress 8 with its confidence limits, coverage and adjusted scores |
| Positive Progress 8 | Pupils with a Progress 8 score of 0 or more, overall, in all four parts, and in each part |
| Basics 9-7, Basics 9-5, Basics 9-4 | Pupils with the grade or above in English and maths, in each one, in neither, and in one only |
| KS4 Results | The five-pass measures, pupils taking more than one language, three single sciences or combined science, combined science grades, and entries per pupil |
| EBacc Total Measure | EBacc entry, slots filled, the average point score (APS) per slot, and standard and strong passes |
| EBacc Elements | Entry, the APS and the two passes for each element: English, Maths, 2 x Sciences, Languages and Humanities |
| Attainment/Progress 8 for English, Maths, EBacc and Open | Average points, average grade, estimate and Progress 8 for each part, with confidence limits |
| Value Added | EBacc value added in science, languages and humanities, with coverage and confidence limits |
Each table has these columns. Their headings are turned on their side, and the collaboration columns are blue.
| Column | What it shows |
|---|---|
| Measure | The measure, such as Average Total Attainment 8 |
| Total | The school’s figure: an average, or a count of pupils |
| % | For a count, the share of pupils |
| Collaboration Data | The same measure across the schools in the Data Collaboration event |
| The data set’s name and vs. Data Collab. (Diff), such as Exams vs. Data Collab. (Diff) | The school’s figure minus the collaboration figure |
The school’s figure is coloured against the collaboration figure:
| Colour | Meaning |
|---|---|
| 51.09 ↑ light green, up arrow | Better than the collaboration figure |
| 8.6 ↓ pink, down arrow | Worse than the collaboration figure |
| No colour | Not compared, such as a confidence limit |
For a measure with NOT in its name, such as Students NOT Achieving 9-5 in English or Maths, a lower figure is better. So 21.9% against 32.5% is light green. Blue, underlined figures are links to the pupils they count. With Compare on, the colours compare the two data sets instead.
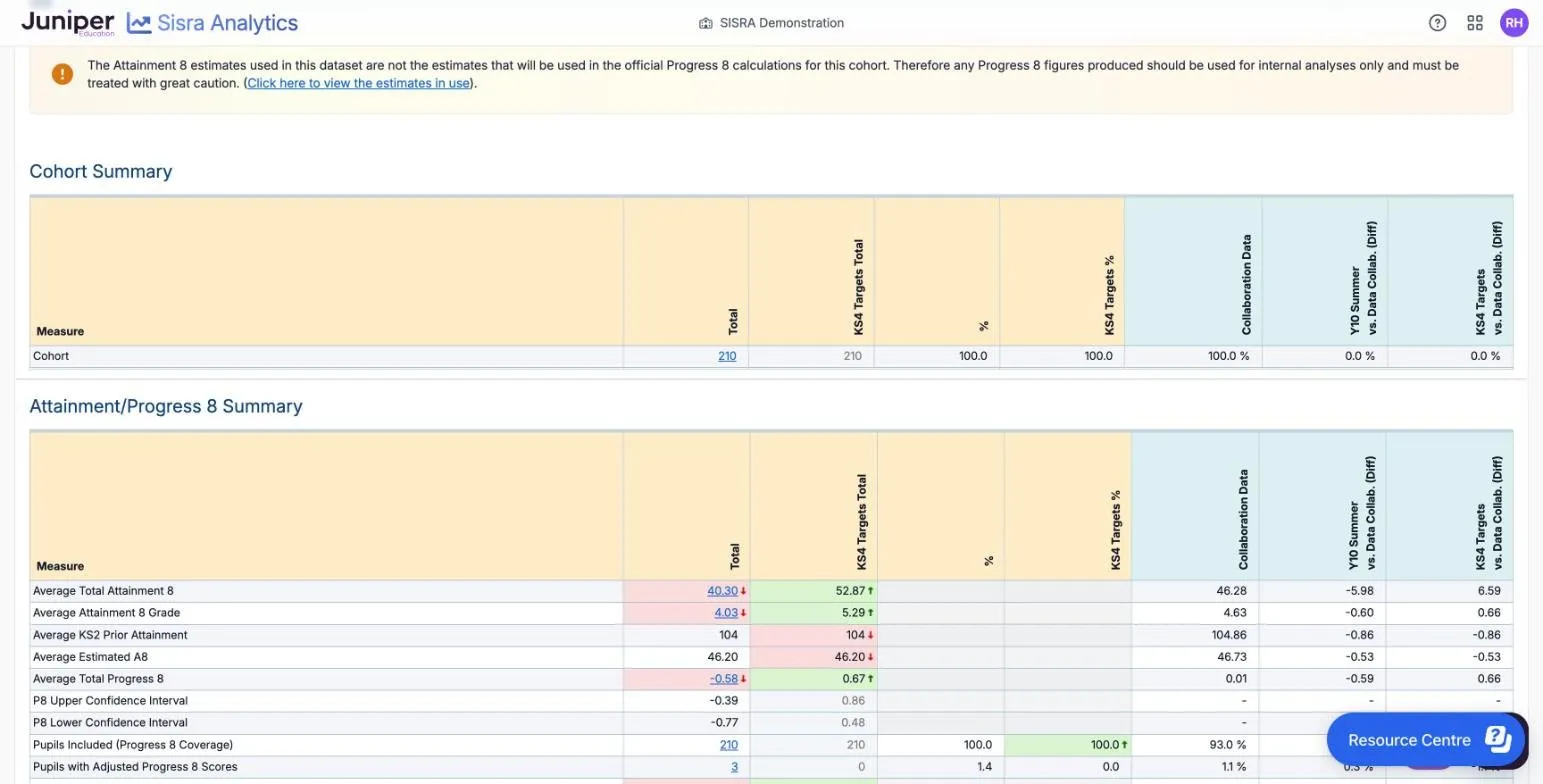
In the 26/27 cohort’s Y10 Summer predictions:
- average Attainment 8 is 40.30, against 46.28 in the 2024 collaboration: 40.30 − 46.28 = −5.98
- grade 4 or above in English and maths is predicted for 93 of the 210 pupils (44.3%), against 65.7%
- grade 5 or above in both is predicted for 30 pupils (14.3%), against 45.7%
- Average Total Progress 8 is −0.58, with limits of −0.77 and −0.39
Both limits are below 0, so on these predictions the cohort’s Progress 8 is significantly below 0. The scores of 3 pupils (1.4%) were adjusted, and without adjustment the figure is −0.59. The collaboration figures are 2024 exam results and these are year 10 predictions, so read each difference as a question about the predictions.
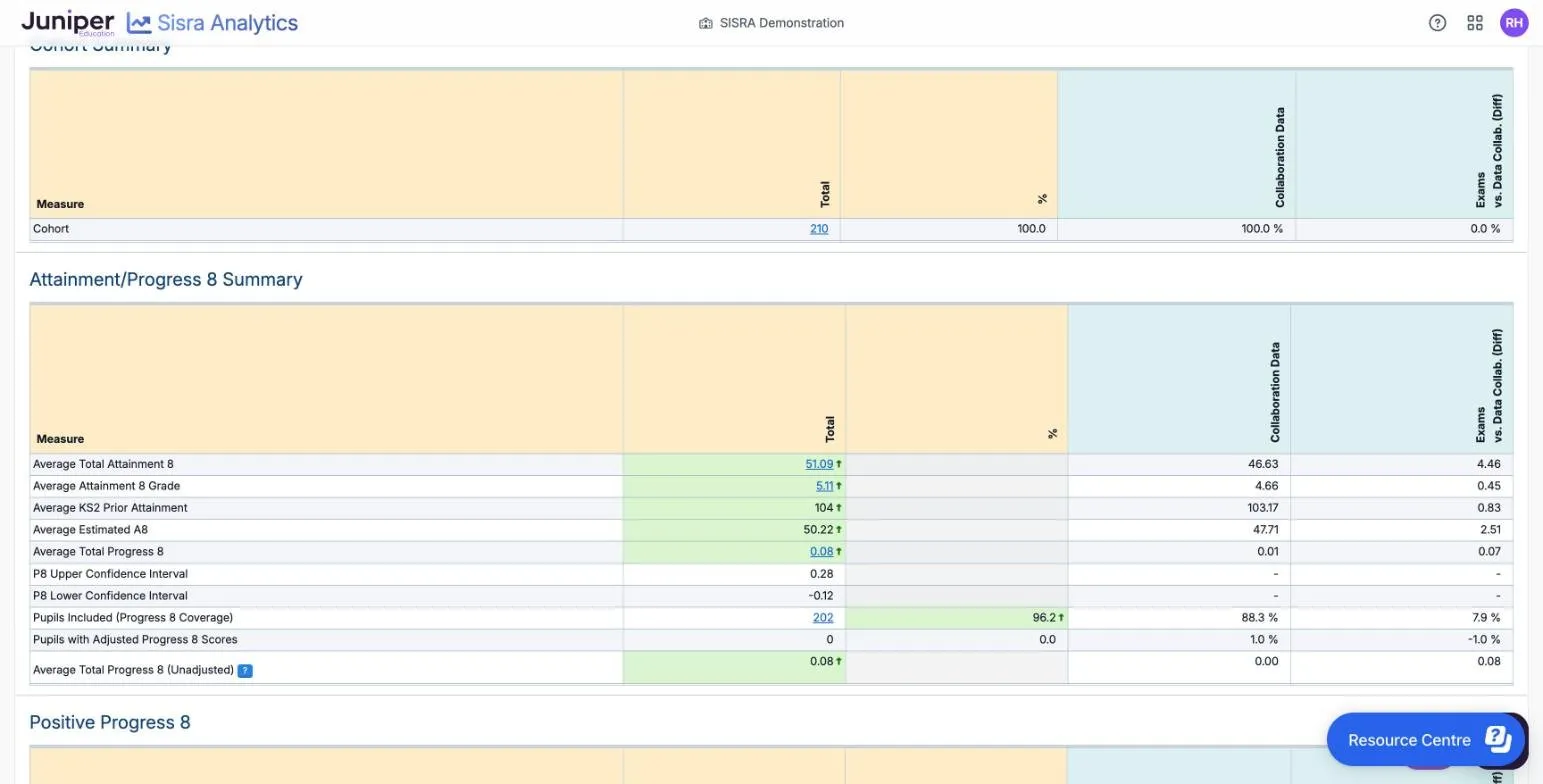
In the 25/26 leavers’ results, average Attainment 8 is 51.09 against 46.63 in the 2026 collaboration, so it is light green. Progress 8 coverage is 202 of 210 pupils (96.2%), so 8 pupils have no KS2 score and count in Attainment 8 but not Progress 8.
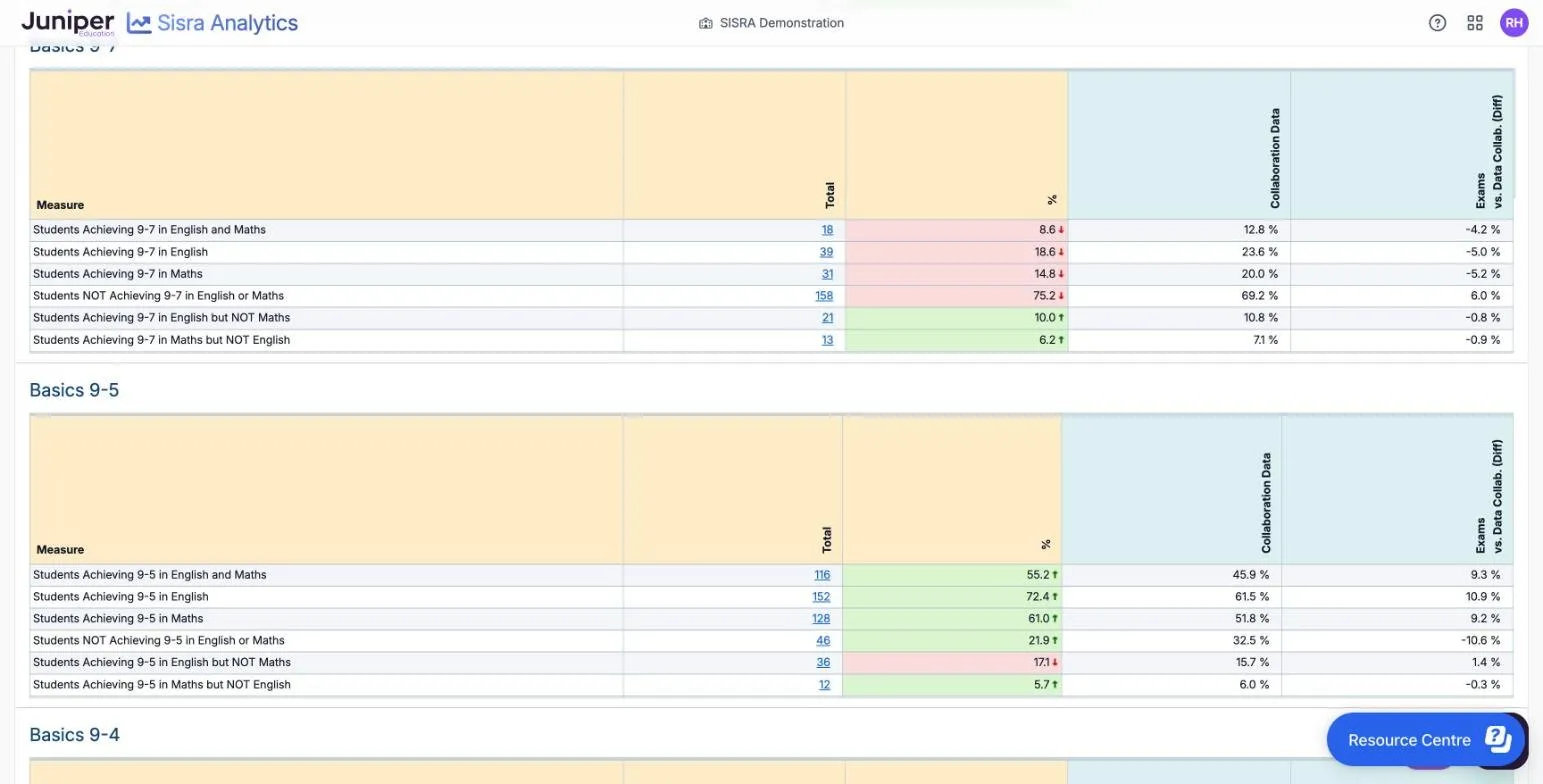
The six rows of each Basics table fit together. In the 25/26 results at 9-5, 152 pupils achieve English and 128 maths, and 116 achieve both. So 152 − 116 = 36 achieve English but not maths, and 128 − 116 = 12 maths but not English. That leaves 210 − 116 − 36 − 12 = 46 who achieve neither.
With Compare
Section titled “With Compare”With Compare on, the Summary adds the second data set’s Total and %, and its own difference from the collaboration. Without collaboration data, or with it hidden, it adds Total (Diff) and % (Diff) instead: the first data set’s figure minus the second’s. The demo school’s Y10 Summer predictions, compared with KS4 Targets, show Attainment 8 of 40.30 against a target of 52.87. Progress 8 is −0.58 against 0.67.
Points to watch
Section titled “Points to watch”Most percentages are of the cohort: the pupils on roll. Two kinds are not:
- Positive Progress 8 percentages are of Pupils Included (Progress 8 Coverage)
- for the science, languages and humanities elements, the passes are shares of the pupils entered, as their names say: Students ENTERED and Achieving
Attainment 8 averages every pupil, but Progress 8 only those with a KS2 score. Check Pupils Included (Progress 8 Coverage) before you compare Progress 8 between groups or years.
The English and maths figures here can differ from those in the Grades Overview. The Summary divides by pupils in the cohort, and the Grades area divides by grades. The Grades area also uses each pupil’s best grade, not the first entry.
Students achieving 5 Standard Passes inc EM and Students achieving 5 Strong Passes inc EM are Sisra’s own measures, not the DfE’s. See Five-pass measures.
Sisra still reports the EBacc. The DfE announced on 4 November 2025 that the EBacc is leaving its headline accountability measures. Its response to the KS4 consultation was still awaited on 15 October 2026. Do not treat the EBacc figures as a target.
The collaboration figures come from schools that use Sisra and opted in. They are an early comparison, not national figures: see What the figures are and are not.
Dashboard
Section titled “Dashboard”The Dashboard shows the main headline figures as tiles and charts.
Options
Section titled “Options”The tabs work as they do on the Summary. Track and the export icon are greyed out. Each tile’s menu, the three lines at its top right, has Download Image.
Read the report
Section titled “Read the report”| Tile | What it shows |
|---|---|
| Cohort | The number of pupils |
| Basics | The share and number of pupils with grade 4 or above (Basics 9-4) and grade 5 or above (Basics 9-5) in English and maths |
| Avg A8 Grade | A dial from 0 to 11, showing the Average Attainment 8 Grade |
| Attainment 8 | Average Attainment 8 as a bar, with a dashed line for the average estimate |
| Progress 8 | Average Progress 8, with a line from the upper to the lower confidence limit |
| APS per EBacc Slot | A dial showing the EBacc average point score per slot |
| EBacc | Bars for the pupils entered, achieving the strong pass and achieving the standard pass |
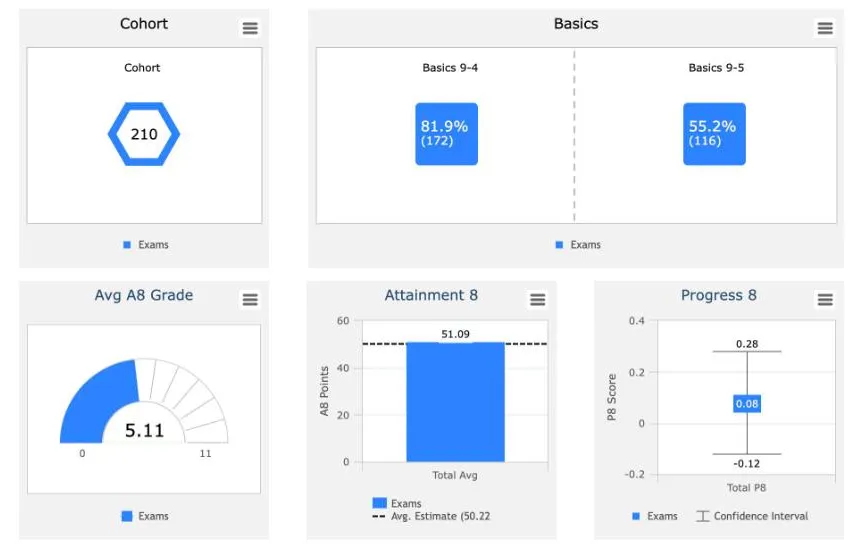
In the 25/26 leavers’ results, 172 pupils (81.9%) have grade 4 or above in English and maths, and 116 (55.2%) grade 5 or above. Average Attainment 8 is 51.09, above the dashed estimate line at 50.22. Average Progress 8 is 0.08, on the demo school’s unofficial KS2 scores, with limits of 0.28 and −0.12. The limits span 0, so the score is not significantly different from 0.
Points to watch
Section titled “Points to watch”The Dashboard’s tiles show only your school’s figures. Use the Summary to compare with other schools.
Charts
Section titled “Charts”The Charts report sets out the headline figures in one table, then as charts.
Options
Section titled “Options”| Option | What it does | Default |
|---|---|---|
| The drop-down on Attainment 8 vs Prior Attainment | Shows Attainment 8 overall, or one part: English, Maths, EBacc or Open | Overall |
| How to ZOOM | Explains how to zoom: drag across part of the Attainment 8 axis. Reset Zoom goes back | Not zoomed |
| The menu on each chart | Download Image |
Read the report
Section titled “Read the report”| Section | What it shows |
|---|---|
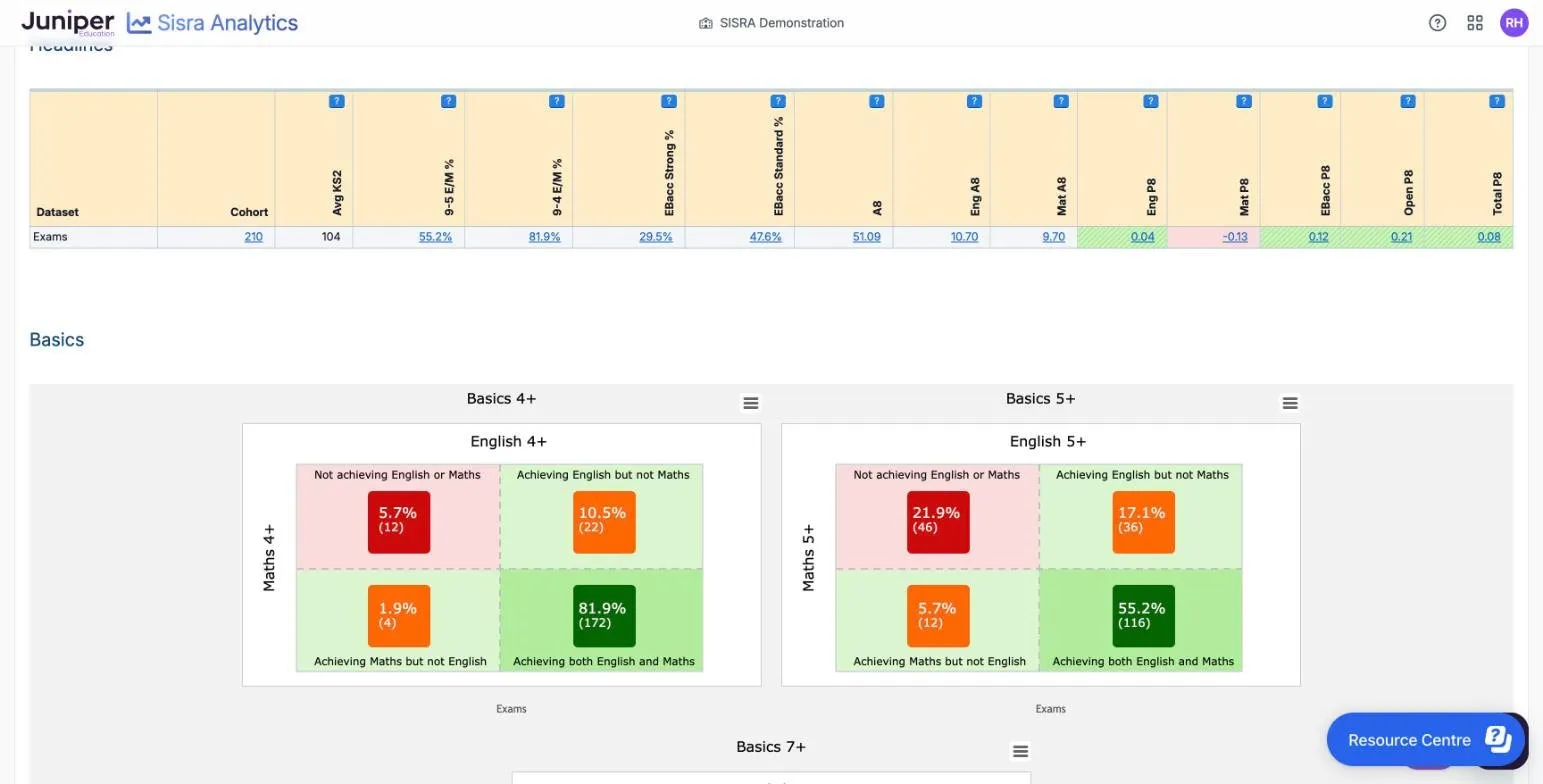
| Headlines | One row: Cohort, Avg KS2, 9-5 E/M %, 9-4 E/M %, EBacc Strong %, EBacc Standard %, A8, Eng A8, Mat A8, Eng P8, Mat P8, EBacc P8, Open P8 and Total P8 |
| Basics | For grade 4, 5 and 7 or above, four boxes: pupils achieving neither English nor maths, English only, maths only, and both |
| Attainment 8 | Dials for the average grade overall and in each part, and bars with dashed lines for the estimates |
| Progress 8 | Each part’s average Progress 8, with its confidence interval |
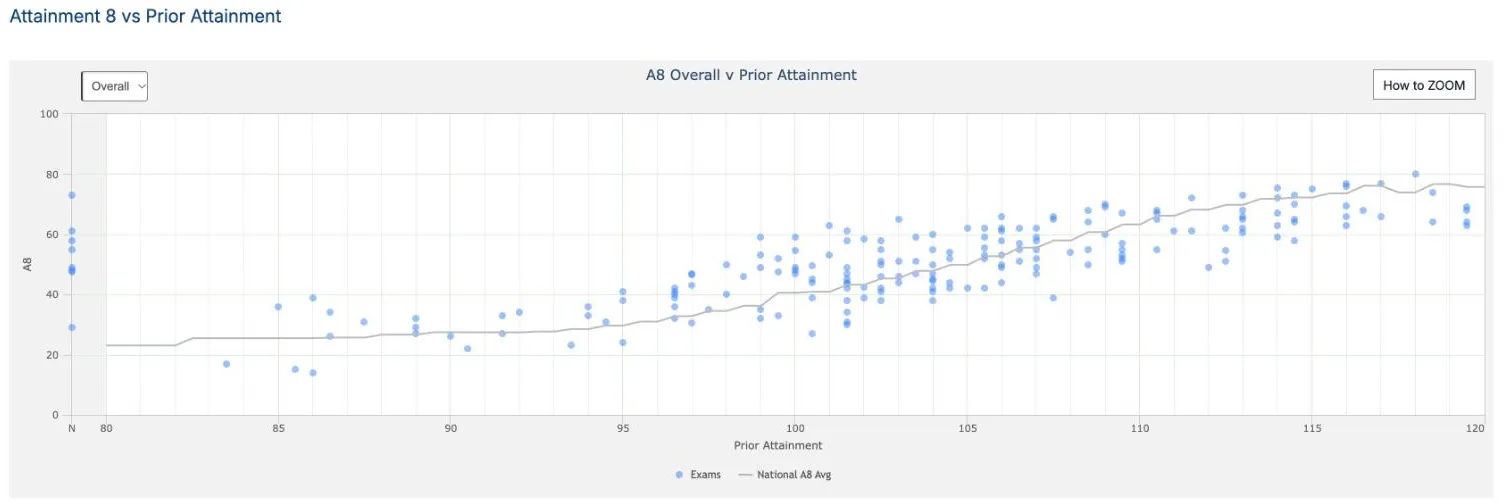
| Attainment 8 vs Prior Attainment | A blue dot for each pupil, placed by KS2 prior attainment across and Attainment 8 up, with a grey line labelled National A8 Avg |
| EBacc | Bars for entry and for strong and standard passes, for the EBacc and each element |
In the Headlines table, a positive Progress 8 is 0.12 green and striped, and a negative one -0.13 pink. In the Basics charts, the box for neither subject is red and the boxes for one subject are orange. The box for both is dark green. Each question mark on a heading gives the measure’s full name, such as “Average Total Progress 8” for Total P8.
In the 25/26 leavers’ results at grade 5, 116 pupils (55.2%) achieve both English and maths and 46 (21.9%) neither. Another 36 (17.1%) achieve English only and 12 (5.7%) maths only.
On Attainment 8 vs Prior Attainment, a dot above the grey line is a pupil whose Attainment 8 beats the line for their KS2 score. Pupils with no KS2 score sit at N, on the left. Pointing to a dot only highlights it.
Points to watch
Section titled “Points to watch”The grey line is the Attainment 8 estimate for each KS2 score, from the estimates the data set was published with. Its label says national, but they may be Data Collaboration or custom estimates. Check Dataset Info to see which estimates the data set uses.
Filters
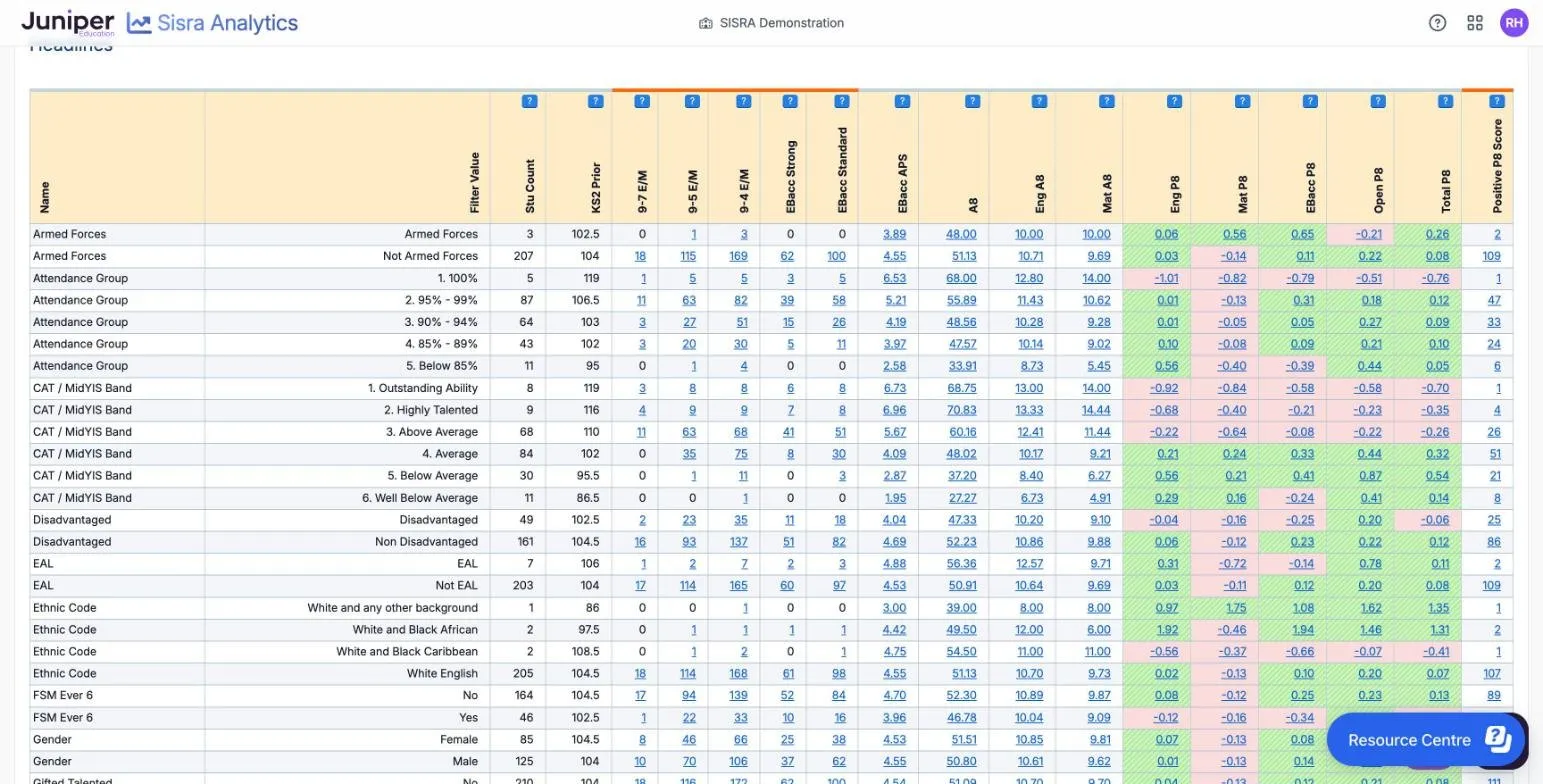
Section titled “Filters”The Filters report gives one row for each value of each filter, such as Disadvantaged and Non Disadvantaged. Each row has the headline measures for the pupils with that value.
Options
Section titled “Options”| Option | What it does | Default |
|---|---|---|
| Sort : | Sorts the rows by any column, such as Total P8 | Name |
| Count : or Percentage : | Shows the columns with an orange line above them as counts of pupils or as percentages | Count |
Read the report
Section titled “Read the report”| Column | What it shows |
|---|---|
| Name, Filter Value | The filter and its value |
| Stu Count | The number of pupils with that value |
| KS2 Prior | Their average KS2 prior attainment |
| 9-7 E/M, 9-5 E/M, 9-4 E/M | Pupils with that grade or above in English and maths |
| EBacc Strong, EBacc Standard | Pupils achieving the EBacc strong or standard pass |
| EBacc APS | Their average EBacc point score per slot |
| A8, Eng A8, Mat A8 | Average Attainment 8, and its English and maths parts |
| Eng P8, Mat P8, EBacc P8, Open P8, Total P8 | Average Progress 8, by part and overall: green and striped above 0, pink below |
| Positive P8 Score | Pupils with a Progress 8 score of 0 or more |
In the 25/26 leavers’ results, the 49 disadvantaged pupils average 47.33 in Attainment 8, against 52.23 for the other 161. Of the 49, 23 (46.9%) have grade 5 or above in English and maths, against 93 of the 161 (57.8%). Their Total P8 is −0.06, against 0.12, on the demo school’s unofficial KS2 scores.
Points to watch
Section titled “Points to watch”Many rows are small groups. In the demo school, the 100% attendance group is 5 pupils. One ethnic group is a single pupil, whose results make up the whole row. Give the number of pupils with every figure you quote, and see Take care with small groups.
A filter with more than 15 values is not listed. Filters show each pupil’s value now, from the latest published student data, not their value when the grades were collected.