


 Sonar Tracker
KS5 reports
Student reports
Two parts of the KS5 reports in Sisra Analytics look at students one at a time. The Students shortcut gives a row for each student, across all their qualifications. Selecting a student’s name in any report opens a panel with their filters, grades and headline measures.
Where to find them: select Students under SHORTCUTS, on the reports home or on any report page. To open the panel, select a student’s name in a report.
Who can see them: authority groups with View EAP KS5 Reports and View Student Report. The panel’s Headlines Summary tab also needs View Headline Report. Admin and User have all three by default.
The examples use the demo school’s 26/27 cohort, this year’s year 13, and its Y12 Spring collection of predicted grades. The panel examples follow one fictional student, Butterworth; Alisha.
The Students shortcut
Section titled “The Students shortcut”Students opens Grade Analysis at On Track, grouped by Students. Each row holds one student’s grades at the performance level chosen on the VIEWS bar, which starts at Level 3. Actual Grades is greyed out, and DISPLAY GRADES AS is set to L3 A*-E Grades, because one row can hold grades of several kinds.
Read the report
Section titled “Read the report”| Column | What it shows |
|---|---|
| Filter Tags | Your school’s tags for filter values, such as Disad and ATT in the demo school |
| Total Grades | The student’s grades at this level |
| Average Pts Per Entry, Average Grade | Their points ÷ entries, and that average as a grade |
| VA | Their value added (VA): green above 0 and pink below |
| A column for each Attitude to Learning (AtL) category, such as Average Judgement Attitude | Their average judgement in that category |
| Avg EAP Diff (Whole), Avg EAP Diff (Sub) | How far their grades are from their expected grades, on average |
| On/Above Track, Above Track, On Track, Below Track, Inc in Track | How many of their grades are at or above, above, on or below their expected grade, and how many have one |
Grade Analysis and AtL reports explains each column and its colours.
In the demo school’s predictions, Butterworth; Alisha has 3 grades averaging 43.33 points per entry, a B+, with value added of 0.65. All 3 are on or above their expected grade: 2 above and 1 on. Her Avg EAP Diff (Whole) is 1.0 and her Avg EAP Diff (Sub) 3.0, both green and striped. Dobson; Aaron has 3 grades averaging 40.00, a B=, with value added of 0.82. One grade is above his expected grade and 2 are below.
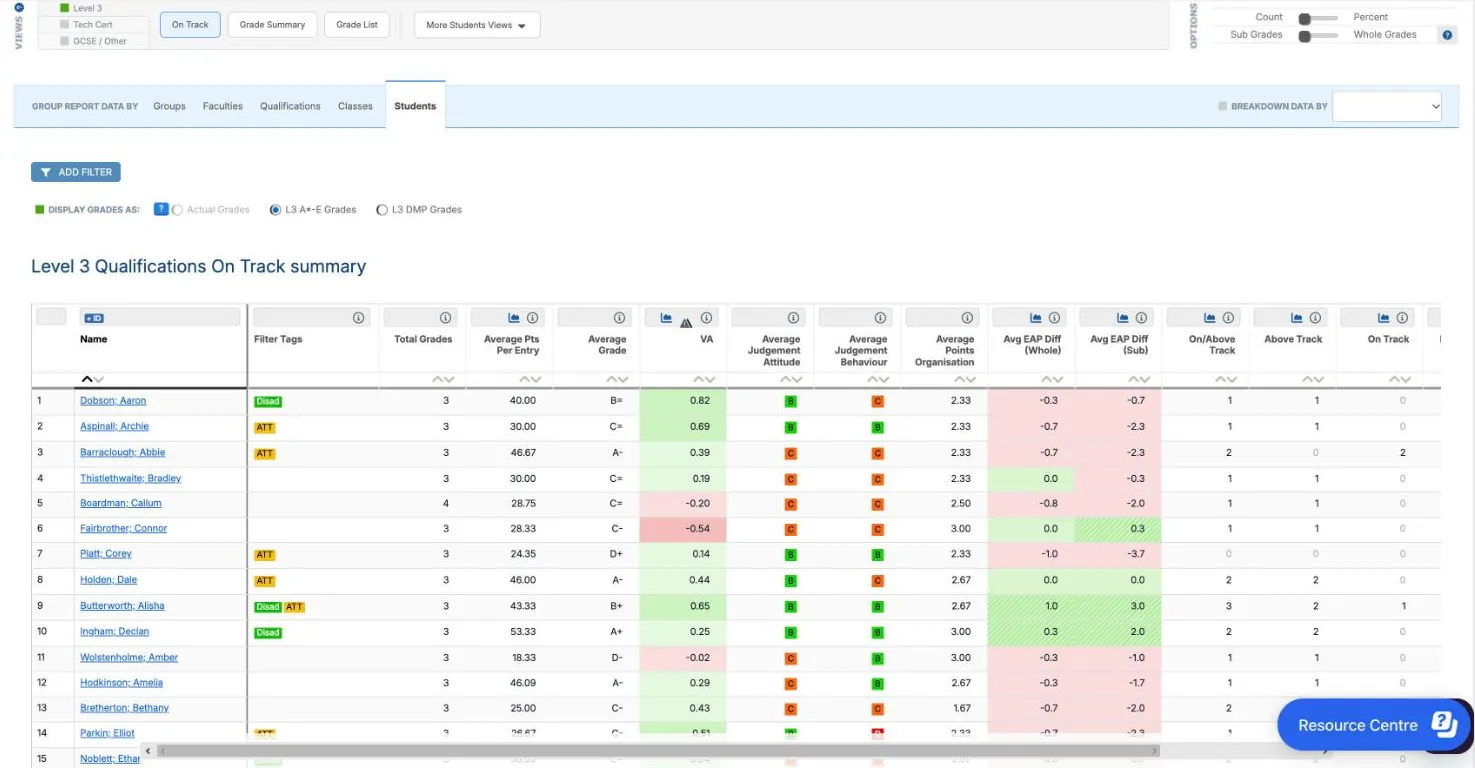
Sort by Avg EAP Diff (Sub) to bring together the students furthest below their expected grades. To look at one group, such as disadvantaged students, use the Student Filters tab in ADD FILTER. KS5 report tools and options describes the filters.
The shortcut lists every student with grades at the level, including students outside the headline cohort. To see grades from technical certificates or GCSE resits, change the level on the VIEWS bar.
Open a student’s panel
Section titled “Open a student’s panel”Select a student’s name in any report. The panel opens on the right of the page.
| Part | What it does |
|---|---|
| A count, such as “1 of 26” | Gives the student’s place in the report you came from |
| < Previous Student, Next Student > | Move through the students in that report |
| The list between them | Jumps to any student in that report |
| Student Information, Simple Overview, Detailed Overview, Headlines Summary | The panel’s four tabs |
| Close, or the cross | Closes the panel, so you can carry on with the report |
The panel opens on the overview that matches the Grade List tab you came from, Simple or Detailed. It moves through the students in the report you opened it from. So to step through one class or group, filter the report first.
Student Information
Section titled “Student Information”Student Information lists the student’s value for each filter, such as Student Status, Gender, Disadvantaged, Registration Group and Attendance Group. It shows the latest published student data, not the values when the grades were collected. Your administrator chooses which filters appear here: see Choose where each filter appears.
Simple Overview and Detailed Overview
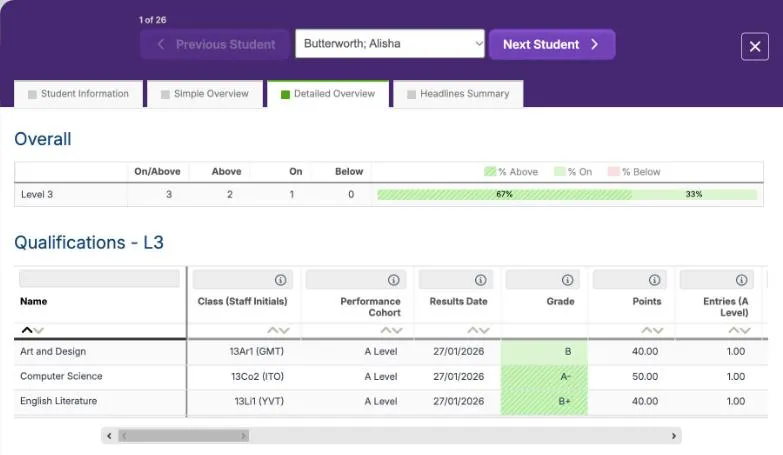
Section titled “Simple Overview and Detailed Overview”Both overviews start with Overall. For each performance level, it counts the student’s grades On/Above, Above, On and Below their expected grade. A bar shows the shares above in green stripes, on in light green, and below in pink.
A table then lists the student’s qualifications at each level, such as Qualifications - L3:
| Column | Tab | What it shows |
|---|---|---|
| Name | Both | The qualification |
| Class (Staff Initials) | Both | The student’s class, with the teacher’s initials |
| Grade | Both | The grade, coloured against the expected grade as in the Grade List |
| VA | Both | The grade’s value added |
| A column for each AtL category | Both | The student’s judgements |
| EAP Grade | Both | The grade expected for this term, from the student’s Expected Attainment Pathway (EAP) |
| Performance Cohort | Detailed | The DfE performance cohort the qualification counts in, such as A Level |
| Results Date | Detailed | The results date your administrator set for the grade |
| Points, Entries (A Level) | Detailed | The grade’s points, and its size in A level entries |
| KS4 Prior, VA Expectation | Detailed | The prior attainment and the expected points behind the value added |
| Residual | Detailed | The grade’s points per entry minus the student’s average |
| EAP Diff (Whole), EAP Diff (Sub), EAP Baseline | Detailed | How far the grade is from the expected grade, and the student’s starting point on the EAP |
Butterworth; Alisha’s three A levels each have 1.00 entry. Her B in art and design is light green, on her EAP grade of B=. Her A- in computer science is green and striped against C=: 2 whole grades and 5 sub-grades above. Her B+ in English literature is above too. So Overall shows 3 on or above, 2 above and 1 on: 67% above and 33% on.
Headlines Summary
Section titled “Headlines Summary”Headlines Summary shows the student’s own headline measures:
| Section | What it shows |
|---|---|
| Value Added | For each qualification with value added: Performance Cohort, KS4 Prior, Grade, Grade Points and VA Expectation, then the value added in each cohort, such as L3 Overall VA, A Level VA and Academic VA |
| Best 3 A Levels | The Qualification, Grade and Slot Points in each Slot, with Grade Status, then the Average and Total |
| Measure tables | The student’s figures in L3 Overall, A Level, Best 3 A Levels, AAB, Academic, Applied General, Tech Level, Tech Cert, English Progress and Maths Progress |
An Eligibility: line above a section says whether the student counts in it, such as “Student counts towards Value Added Headline figures”. Each section has a bookmark icon: select it to keep your place on that section as you move between students. If you came from some reports about one measure, its section is bookmarked for you.
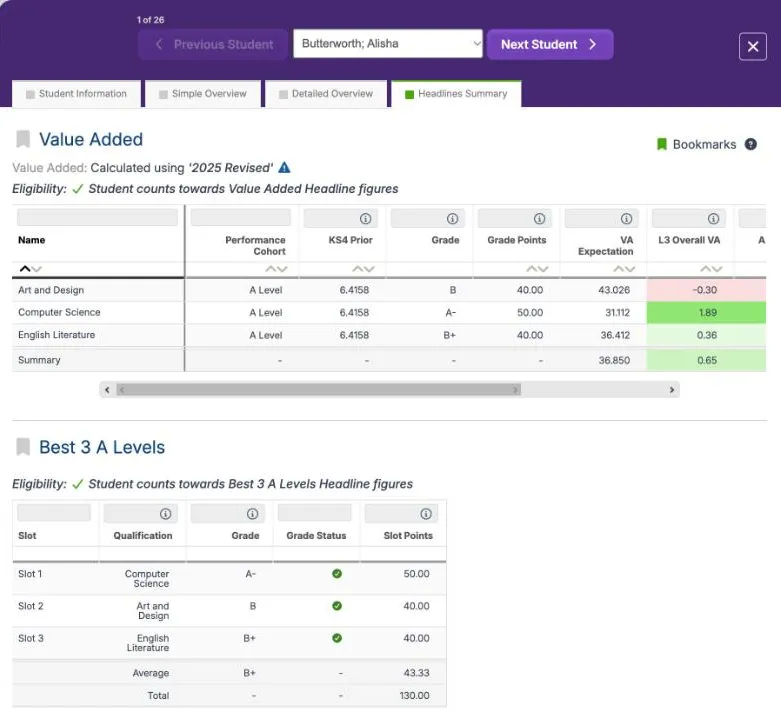
Butterworth; Alisha’s KS4 prior attainment is 6.4158. At that score, students nationally average 43.026 points in art and design, but 31.112 in computer science. So her B in art and design, worth 40, gives (40 − 43.026) ÷ 10 = −0.30. Her A- in computer science, worth 50, gives (50 − 31.112) ÷ 10 = 1.89, and her B+ in English literature gives 0.36. Her L3 Overall VA is the average of the three: (−0.30 + 1.89 + 0.36) ÷ 3 = 0.65.
Her first Best 3 A Levels slot holds her A- in computer science, worth 50 points. Her B in art and design and her B+ in English literature fill the other two, at 40 each. That totals 130, and 130 ÷ 3 = 43.33, a B+.
Points to watch
Section titled “Points to watch”The +, = and - on a predicted grade do not change its points: an A- is worth 50 and a B+ 40.
The Value Added table fills even when the student does not count in the school’s value added, so read the Eligibility: line. Its summary can also differ from the student’s figure in the Value Added report, which uses only grades that count in the headline figures.
Sisra also works out value added for students with the status Guest, who never count in the school’s figures. The demo school’s 26/27 cohort has no guests.
The panel holds personal data about one student. Take care where you show it, and store any exports as your school’s data protection policy says.