


 Sonar Tracker
Students
Map key filters
Key filters are three standard filters in Sisra Analytics: Disadvantaged, Gender and SEN. Schools record these in different ways, so for each cohort you map your own filter values to Sisra’s. Trend reports, Sisra Multi-School and Sisra Data Collaboration can then compare like with like.
Before you start
Section titled “Before you start”You need:
- an authority group with Access Data Section, such as Admin
- a filter in your Student Data Profile for each key filter, imported for the cohort
Authority groups and permissions explains Access Data Section. If you have no Disadvantaged filter, create one and import it with the student data. See Create a filter.
At KS3/4, Key Filter Mapping appears for the cohorts that Data Collaboration covers. These are leavers and the current years 10 and 11. Juniper Education’s guides say year 9 is added later in the school year, but disagree on the term. If your school has not opted in to a Data Collaboration event since 2018, the page says so. At KS5 the page is always in the menu.
What uses key filters
Section titled “What uses key filters”| Feature | What mapping gives it |
|---|---|
| Headline Trends and Qualification Trends | A Key Filter Value: drop-down that filters the trends by Disadvantaged, Gender or SEN. Every cohort in the trend needs mapping and published student data |
| Sisra Multi-School, for trusts | The cohort’s data, from the 21/22 cohort onwards. Sisra passes it to the trust’s reports when you publish grades, but only once the cohort is mapped |
| Sisra Data Collaboration (KS3/4) | Your results in the collaboration figures, and breakdowns by key filter. Without mapping, your data is left out and you cannot see the collaboration figures |
Take part in Sisra Data Collaboration and Get school data into Multi-School explain the other set-up those features need.
Map a key filter
Section titled “Map a key filter”- Open the cohort in DATA, then select Students, then Key Filter Mapping.
- In the Sisra Key Filter column, select a key filter’s name, such as Disadvantaged. Its mapping page opens, such as Disadvantaged Filter Name & Value Mapping.
- In Use the values from the Student Data Filter:, choose your filter. Then, for each School Filter Value, choose the matching SISRA Filter Value.
- Select Save, which stays greyed out until you change something.
- Repeat for the other two key filters.
- Publish student data.
If everyone in the cohort has the same value, choose it in All of the students in this cohort are: instead of step 3. For example, choose Male for Gender in a boys’ school.
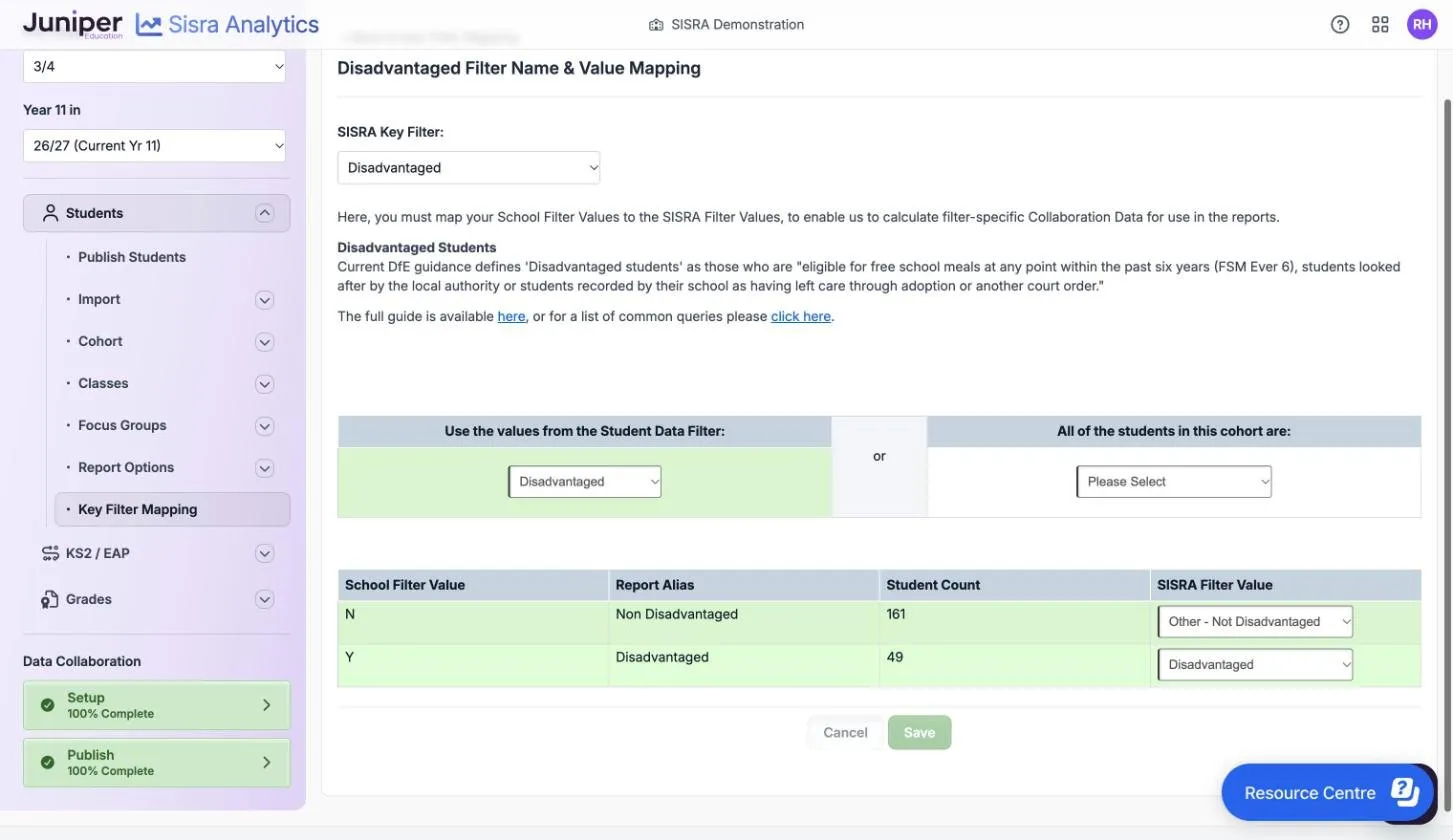
The mapping page shows each value’s Report Alias and its Student Count. These are Sisra’s values for each key filter:
| Key filter | SISRA Filter Value options |
|---|---|
| Disadvantaged | Disadvantaged, Other - Not Disadvantaged |
| Gender | Female, Male, Non-Binary / Not Specified |
| SEN | E - EHC plan, K - SEN Support, N - None. KS5 also has S - Statement |
Schools that do not report to the DfE can also choose Do Not Include under All of the students in this cohort are:. Data Collaboration then has no breakdown by that filter for them.
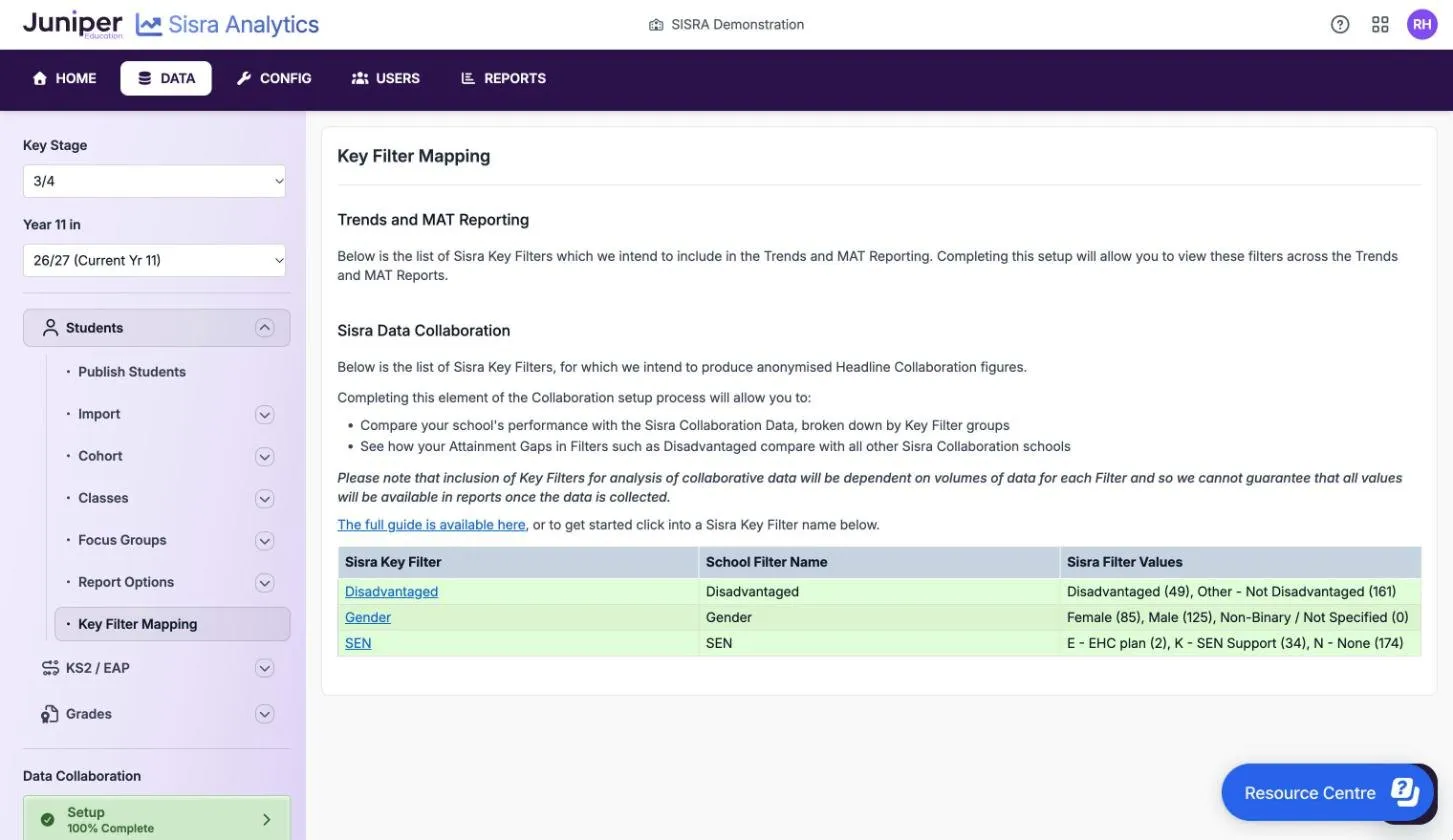
Back on Key Filter Mapping, a mapped key filter shows in green. School Filter Name shows your filter, and Sisra Filter Values the counts. The counts should add up to the cohort. In the demo school, Disadvantaged has 49 + 161 = 210 pupils, the whole 26/27 cohort.
Map key filters at KS5
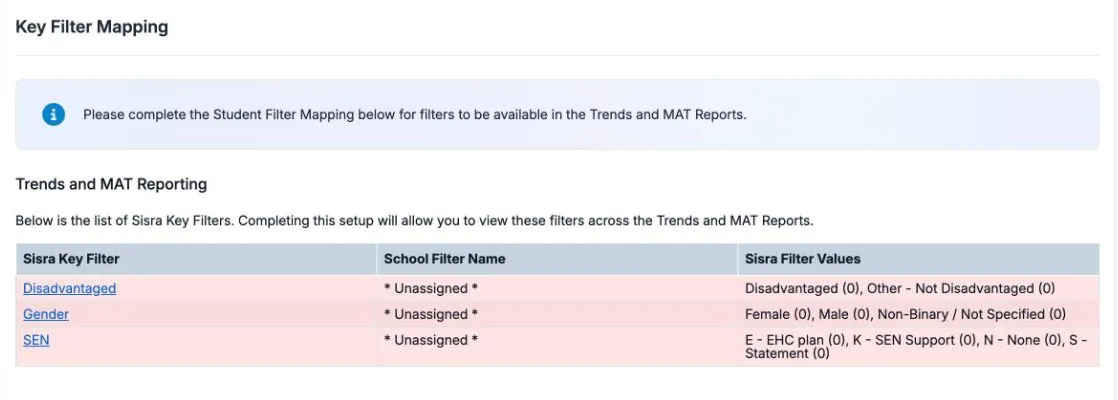
Section titled “Map key filters at KS5”KS5 works in the same way. Its page has only the Trends and MAT Reporting section, because there is no KS5 Data Collaboration. An unmapped key filter shows * Unassigned *, shaded red.
Until all three are mapped, the MAT Contribution check in the KS5 publish dialog reports “Key Filter Mapping has not been completed for this cohort”.
Use the DfE’s definitions
Section titled “Use the DfE’s definitions”Map your values to the DfE’s definitions, not to the nearest filter you have. Sisra cannot check that you chose the right filter.
Disadvantaged. The DfE counts three groups of pupils as disadvantaged. They are those “eligible for free school meals at any time during the last 6 years”, looked-after children and children adopted from care. This is from the DfE’s secondary accountability measures guidance for 2025, updated 16 October 2025. Other filters are close, but not the same:
| Filter | Free school meals in the last 6 years | Looked after | Left care by adoption or court order | Service children |
|---|---|---|---|---|
| Disadvantaged (DfE) | Yes | Yes | Yes | No |
| FSM Ever 6 | Yes | No | No | No |
| Pupil premium | Yes | Yes | Yes | Yes |
So FSM Ever 6 fits only a cohort with no looked-after or previously looked-after pupils. A pupil premium filter fits only a cohort with no service children. Otherwise, create a separate Disadvantaged filter.
Gender. Map to Female, Male or Non-Binary / Not Specified. Data Collaboration leaves Non-Binary / Not Specified out of its gender breakdown only.
SEN. Map to E - EHC plan, K - SEN Support or N - None, the codes the school census uses. S - Statement is a legacy value for statements of SEN, which EHC plans replaced.
Map new values when the mapping is incomplete again
Section titled “Map new values when the mapping is incomplete again”A finished mapping can show a menu icon and a warning that it is incomplete again. This happens when:
- new filter values are imported or created
- someone’s filter values are edited
- someone’s On Roll status changes
- the mapped filter is taken out of the Student Data Profile, which clears its mapping
Open the key filter, map the new values, select Save, then publish student data.
A row reading (None) means some people have a blank value. Export the cohort to find them: see Export the cohort.
If something goes wrong
Section titled “If something goes wrong”Publishing student data warns “Filter mapping is currently incomplete”. At least one key filter is not mapped. You can still publish, but the cohort stays out of Data Collaboration and the trust’s reports.
Key Filter Mapping is missing from the menu (KS3/4). Data Collaboration does not cover the cohort yet, such as a year 7 or year 8 cohort.
The trend reports cannot filter figures by key filter. Every cohort in the trend needs mapping and published student data.
The school is missing from the trust’s reports. Map the key filters, then republish the cohort’s grades. See Get school data into Multi-School.