


 Sonar Tracker
KS3/4 reports
Report tools and options
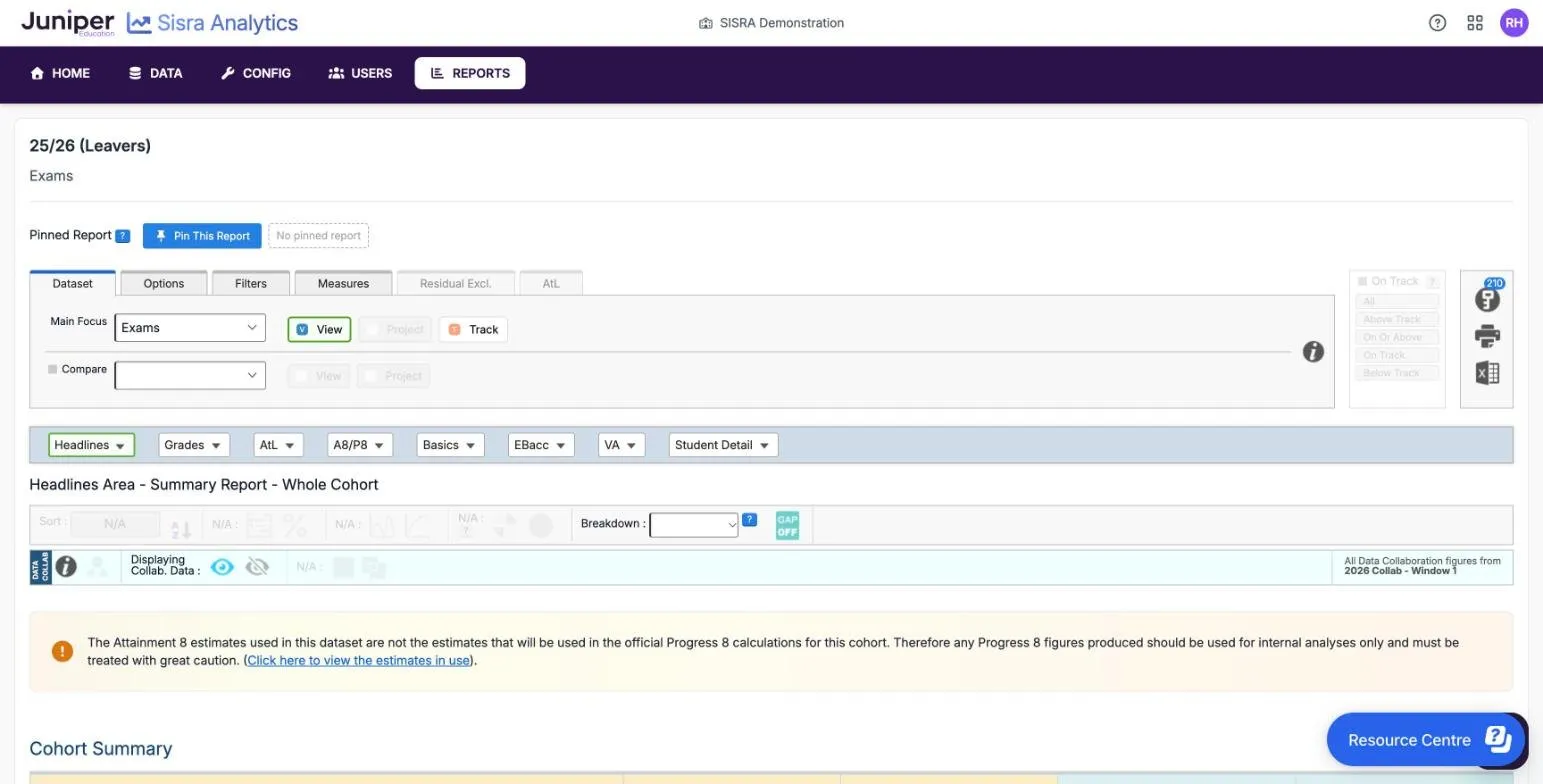
Every KS3/4 report in Sisra Analytics sits in the same frame: tabs of options, a bar of report areas, a toolbar, then the report. This page describes each tool and option, with its default, so you can change what a report shows and know what you are looking at.
Where to find it: select REPORTS, then KS 3/4, then a report button such as Whole Cohort. Open the KS3/4 reports gives the steps.
Who can see it: authority groups with View EAP KS3/4 Reports. Each level of report needs its own permission, as Areas, reports and levels explains.
The examples use the demo school’s 26/27 cohort, this year’s year 11, and its 25/26 leavers. The demo school’s KS2 scores for 25/26 are not official: that cohort took no KS2 tests.
The report page
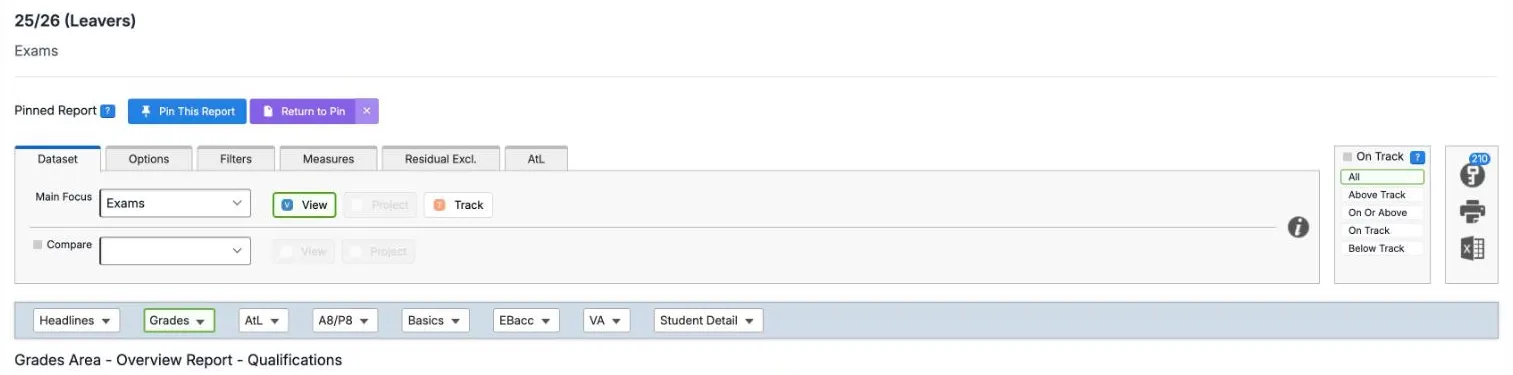
Section titled “The report page”From the top, each report has these parts:
| Part | What it shows |
|---|---|
| Header | The cohort and the data set, such as 25/26 (Leavers) and Exams. It says when you project, track or compare, such as “Y10 Summer (Assessments), compared with KS4 Targets” |
| Pinned Report | Pin This Report, then Return to Pin once you have pinned a view |
| Tabs | Dataset, Options, Filters, Measures, Residual Excl. and AtL |
| On Track | Filters for grades above, on or below the expected grade |
| Icons | The key (Key Characteristics), with the number of pupils in the report, then Print and Export To Excel |
| Area bar | Headlines, Grades, AtL, A8/P8, Basics, EBacc, VA and Student Detail, each with a menu of reports |
| Report title | The area, report and level, such as “Headlines Area - Summary Report - Whole Cohort” |
| Toolbar | Sort, counts or percentages, standard or cumulative, Sub or Whole, Breakdown and GAP |
| DATA COLLAB bar | Sisra Data Collaboration controls, and the event the collaboration figures come from |
| Banners | Warnings and notes about the data, such as estimates that are not the official ones |
| The report | Tables or charts. Most tables end with a Summary row for everyone in the report, and legends follow |
A control that does not apply to the report is greyed out, and the toolbar shows N/A : in its place. The DATA COLLAB bar is described in The Data Collaboration bar.
Areas, reports and levels
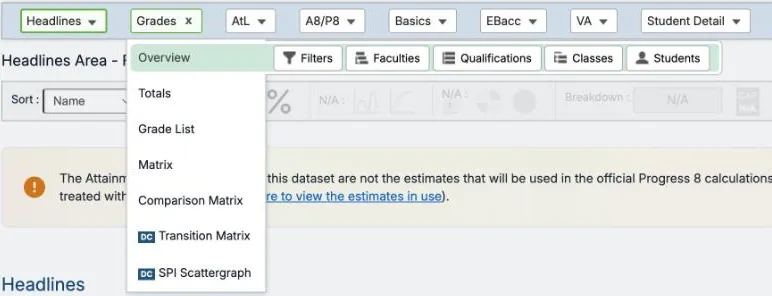
Section titled “Areas, reports and levels”Select an area on the area bar to open its menu. Point to a report to see its levels, then select a level. The open area has a green outline.
| Area | Reports | Levels |
|---|---|---|
| Headlines | Summary, Dashboard, Charts, Filters | Whole Cohort |
| Grades | Overview, Totals | Filters, Faculties, Qualifications, Classes, Students |
| Grades | Grade List, Matrix, Comparison Matrix, Transition Matrix, SPI Scattergraph | Students |
| AtL | Overview | Filters, Faculties, Qualifications, Classes, Students |
| A8/P8 | A8 Overview, P8 Overview, Eng/Mat, EBacc, Open | Filters, Students |
| Basics | Contribution | Filters, Faculties, Qualifications, Classes, Students |
| EBacc | Standard Pass, Strong Pass | Filters, Students |
| VA | Overview | Filters, Students |
| Student Detail | Overview, Headlines | Students |
The level sets what each row is. Whole Cohort is everyone in the report. Filters gives a row for each value of each filter, such as Disadvantaged and Non Disadvantaged, for filters with 15 values or fewer. Faculties, Qualifications, Classes and Students give a row for each faculty, qualification, class or pupil.
Who can open each level
Section titled “Who can open each level”| Level | Authority group action |
|---|---|
| Whole Cohort | View Headline Report |
| Filters, Faculties, Qualifications and Classes | View Qualification Report |
| Students, and the Student Detail area | View Student Report |
Levels and links your group cannot open are hidden. By default the Admin and User groups have all three actions. Authority groups and permissions explains each one.
When an area is greyed out
Section titled “When an area is greyed out”An area that cannot show the data set is greyed out, with a question mark. Its message gives the reason, in terms of Attainment 8 (A8) points, DfE rules or Attitude to Learning (AtL) judgements:
| Area | Message |
|---|---|
| Headlines, A8/P8 | “Only available for data sets using A8 points and published with DfE Rules.” |
| Basics, EBacc, VA | “Only available for data sets using A8 points, published with DfE Rules and with at least one qualification nominated in the SPECIAL column on the Matching page.” |
| AtL | “Only available for data sets published with at least one AtL judgement in an active category, with a corresponding grade.” |
So a KS3 collection graded in percentages has no headline areas. Some reports also need a choice before they show anything, such as “Please select a Qualification” or “Please select a Student”. The option the report needs is marked in red on the Options tab.
The tabs
Section titled “The tabs”The six tabs above the area bar hold the report’s options. A tab that does not apply to the report is greyed out. When you set an option, its tab shows a green number and a reset arrow, and All with a reset arrow appears beside the tabs.
| Tab | What it does | Default |
|---|---|---|
| Dataset | Chooses the data set you are viewing, a second one to compare, and View, Project or Track | The data set you opened, in View |
| Options | Narrows the report to a faculty, qualification, class, grade type or grade | Nothing chosen |
| Filters | Narrows the report to pupils with the filter values you choose | No filters |
| Measures | Narrows the report to pupils included in, or left out of, headline measures | No measures |
| Residual Excl. | Leaves qualifications out of residuals | Every qualification included |
| AtL | Narrows the report to grades with chosen AtL judgements | No judgements chosen |
Dataset
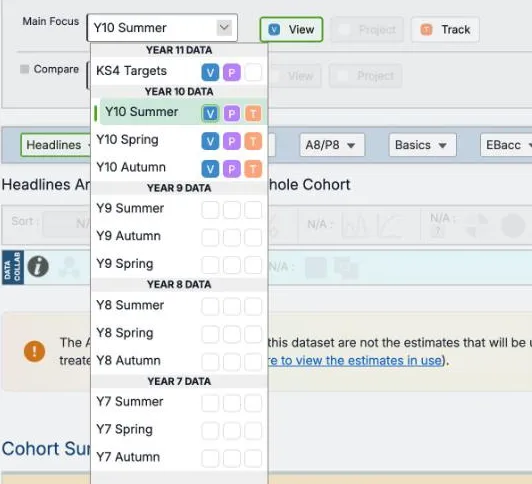
Section titled “Dataset”Main Focus is the data set or assessment collection you are viewing. Its list groups the cohort’s published reports by year, such as YEAR 10 DATA, and gives each one up to three boxes:
| Box | What it opens |
|---|---|
| V | The report as published: View |
| P | The report with Sisra Basic Projections: Project |
| T | The cohort’s tracker, for a data set that is in it: Track |
An empty box means that choice is not available from the report you are on. For example, the 26/27 cohort’s KS3 collections have empty boxes in a Headlines report. The current choice has a green outline.
The i icon opens Dataset Information. It shows how the data set was published: the DfE rules year, the Attainment 8 and value added estimates, and any Data Collaboration event. Dataset Info on the reports home shows the same details.
Options
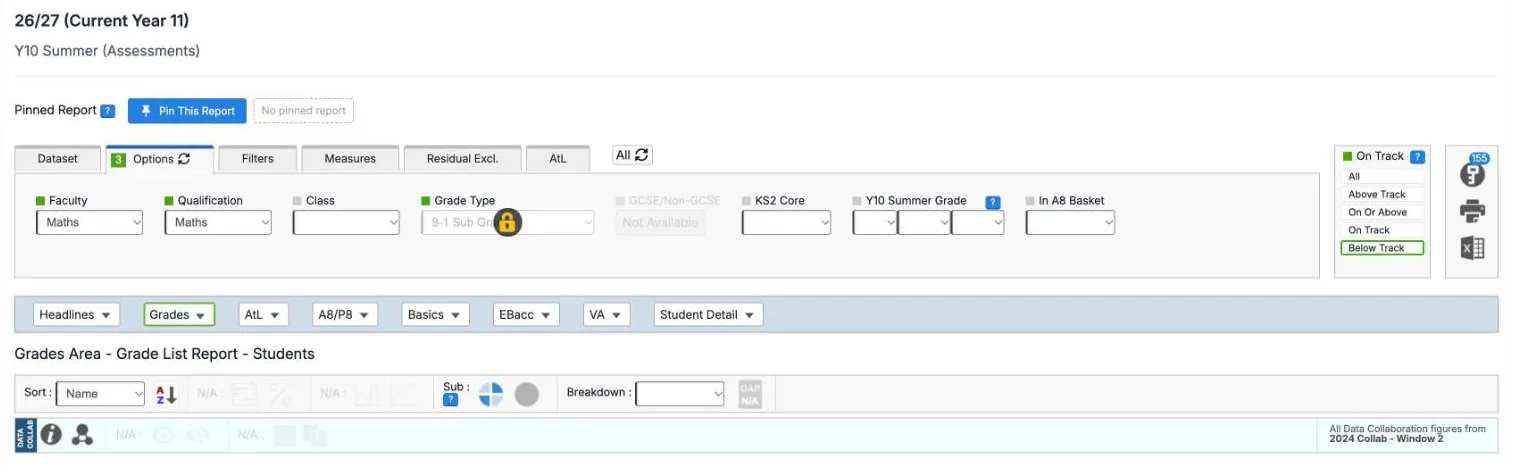
Section titled “Options”Options holds drop-downs that narrow the report, and the list changes with the report. Each has a small square beside its name: grey when not set, green when set, and red when the report needs it.
| Option | What it does | Default |
|---|---|---|
| Faculty | Shows only the faculty’s qualifications | None |
| Qualification | Shows one qualification, and locks Grade Type to its grade method, with a padlock | None. Most Students-level Grades reports need one |
| Class | Shows one class in the chosen qualification | None |
| Grade Type | Shows one grade method, such as 9-1 Sub Grades | None, so each grade method has its own table |
| GCSE/Non-GCSE | Shows only GCSE-type qualifications, or only the others | None |
| KS2 Core | Shows pupils with one KS2 prior attainment score, such as 105 | None |
| The data set’s grade, such as Exams Grade or Y10 Summer Grade | Shows pupils with a grade equal to, above, at or above, or below the grade you choose, including sub-grades | None |
| In A8 Basket | Shows grades that are, or could be, in an Attainment 8 slot, or those that are not | None |
| Student | Chooses the pupil, in Student Detail | None |
| AtL Category | Chooses the category, in the AtL area. It sits on the AtL tab | None |
In the Grades Overview and Totals and the AtL Overview, Grade Type can also offer All A8 Quals. It appears when the data set uses more than one grade method with Attainment 8 points. It puts every qualification with Attainment 8 points on one 9 to 1 scale. A grade’s place on that scale comes from its points, so a BTEC Distinction* worth 8.5 points counts as an 8.
Filters
Section titled “Filters”Select Add Filters, tick the values you want, then select Apply. The list holds the cohort’s filters, such as Disadvantaged, SEN and Registration Group, and also Focus Group and Student Status. Check All and Uncheck All work on one filter at a time.
Values from the same filter widen the group: Female and Male together include everyone. Values from different filters narrow it: Female and Disadvantaged include disadvantaged girls only. Two focus groups include anyone in either.
Once applied, the button reads Add/Remove Filters and a box shows each filter you chose. Every figure, and Key Characteristics, is then worked out for those pupils only. In the demo school’s 26/27 cohort, Disadvantaged leaves 49 of 210 pupils.

Filters do not change the collaboration figures, which are for all pupils in the collaboration. To compare a group with the same group in other schools, use Breakdown instead.
Headline figures already leave out guests. To leave them out of a Grades report as well, tick On Roll under Student Status. Administrators choose which filters appear here: see Choose where each filter appears.
Measures
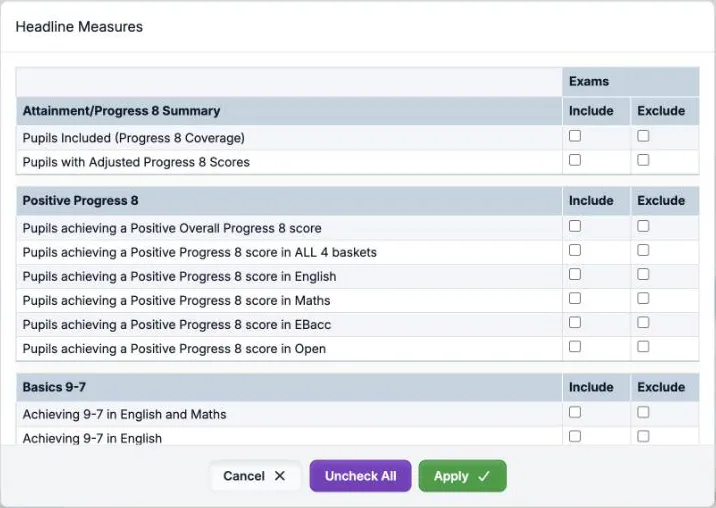
Section titled “Measures”Measures narrows the report to pupils who are in, or not in, chosen headline measures. Select Add Measures to open Headline Measures. It lists each measure, in the same groups as the Headlines Summary, with Include and Exclude boxes. Tick the boxes you want, then select Apply.
| To find | Choose |
|---|---|
| Pupils with no KS2 result | Exclude for Pupils Included (Progress 8 Coverage) |
| Pupils with grade 5 or above in English but not in maths | Under Basics 9-5, Include for the English measure and Exclude for the maths measure |
| Pupils entered for the English Baccalaureate (EBacc) who do not achieve it | Include for the EBacc entry measure and Exclude for the EBacc pass |
With Compare on, you can include a measure in one data set and exclude it in the other. For example, find pupils targeted to reach grade 5 in English and maths who are not reaching it now. Open Key Characteristics afterwards to see who these pupils are, such as how many are disadvantaged.
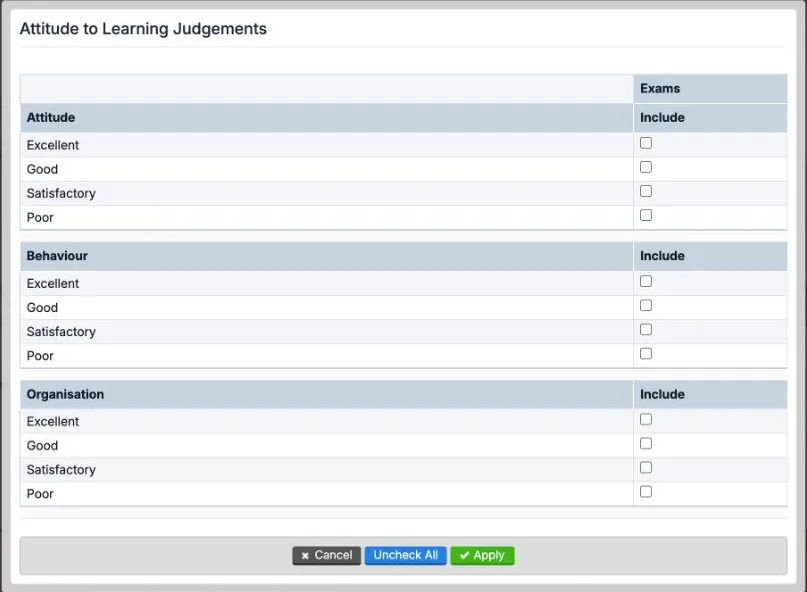
Select Add AtL Filters to open Attitude to Learning Judgements. It lists each of your school’s AtL categories, such as Attitude, Behaviour and Organisation, with their judgements, such as Excellent to Poor. Tick the judgements to include, then select Apply. For example, tick Poor under Behaviour to see the grades that carry that judgement.
The tab works in the Grades, AtL and Student Detail areas. In the AtL area it also holds AtL Category, which the report needs.
Residual Excl.
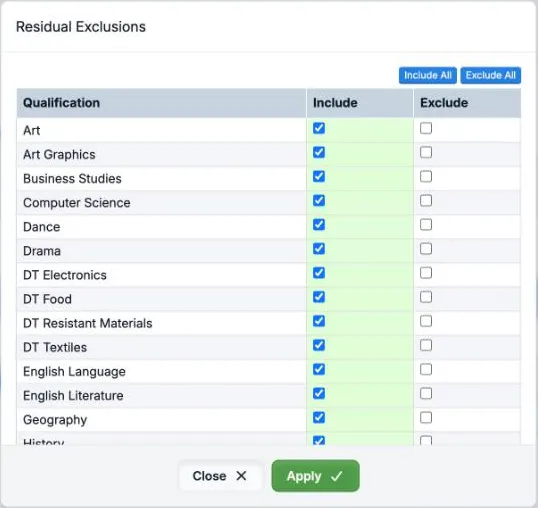
Section titled “Residual Excl.”A residual compares a pupil’s result in one qualification with their average across all their qualifications. Residual Excl. leaves chosen qualifications out of that average. Select Add Exclusions to open Residual Exclusions, tick Exclude for each qualification to leave out, then select Apply. Include All and Exclude All set every row at once.
The tab works in reports with a Residual column. One use is to leave out vocational qualifications and compare residuals among GCSEs alone. Residuals explains the calculation.
View, Project, Track and Compare
Section titled “View, Project, Track and Compare”The Dataset tab switches between four ways of showing the data:
| Mode | What it shows | How to choose it |
|---|---|---|
| View | The data set as published. The default | View, or V in the Main Focus list |
| Project | Each pupil’s grades projected to the end of KS4, with every figure worked out again from them | P in the Main Focus list |
| Track | The data sets in the cohort’s tracker, side by side | Track, or T in the Main Focus list |
| Compare | A second data set beside the first | V or P next to a data set in the Compare list |
Project
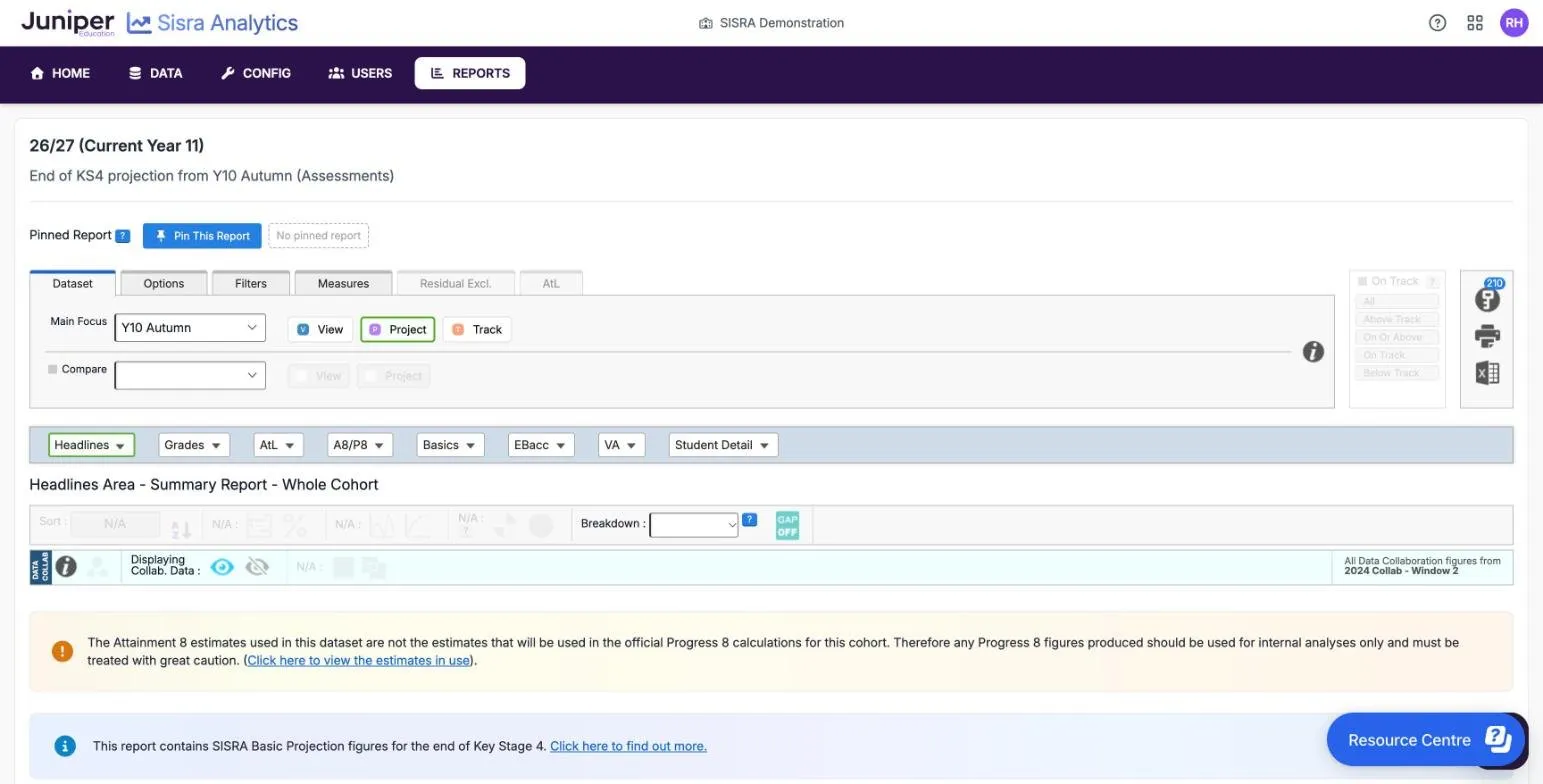
Section titled “Project”Project shows Sisra Basic Projections (SBP). SBP uses your Expected Attainment Pathways (EAPs) to project each grade to an end-of-KS4 grade. The header then reads, for example, “End of KS4 projection from Y10 Autumn (Assessments)”. A blue banner says: “This report contains SISRA Basic Projection figures for the end of Key Stage 4.”
The Headlines Summary then shows how the headline measures might look at the end of KS4. The Grades reports show projected grades, and in the Grade List, EAP Grade is the expected grade for the KS4 exams. AtL judgements are not projected, as the banner says.
Project needs:
- EAPs with expected grades up to the KS4 exams
- the data set published with SISRA Basic Projections (SBP) on
- grades from a term before the KS4 exams, such as a year 10 collection
Use P in the Main Focus list: the Project button on the tab stays greyed out while you view a report. In the demo school, the projections hold no grades. The Headlines Summary shows a cohort of 210 but an Attainment 8 of 0.00. Grades Overview says “There are no entries to display for this selection”.
A projection assumes each pupil stays on the pathway their current grade sits on. Juniper Education says projections are “not intended to provide an accurate reflection of the final figures for the cohort”. Sisra Basic Projections explains how they are made.
Track shows the data sets in the cohort’s tracker side by side, coloured where a figure rises or falls. Project and Compare are switched off and the DATA COLLAB bar is hidden. Select View to go back to one data set. Tracker reports explains how to read it.
Compare
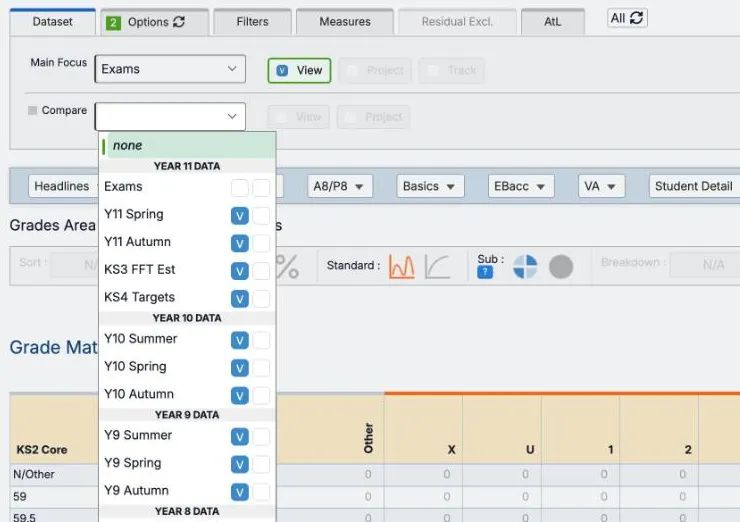
Section titled “Compare”Compare sets another published data set for the same cohort beside the one you are viewing, such as KS4 targets beside a year 10 collection. Open the Compare list and select V next to the data set, or P for its projection. The header adds “compared with” and the data set’s name, and the Dataset tab shows a green number. To stop comparing, choose none.
| Report | What Compare adds |
|---|---|
| Headlines Summary | Columns for the second data set, such as KS4 Targets Total, KS4 Targets % and its difference from the collaboration. With collaboration data hidden, Total (Diff) and % (Diff) take the place of the collaboration columns |
| Grades Totals | KS4 Targets > and Difference > rows under each row. Also columns counting grades on or above, above, equal to and below the second data set’s grade, and N/A for grades it cannot compare |
| Grade List | A second row for each pupil, such as KS4 Targets >, and the columns Grade Points (Diff) and Subject Progress Index (Diff) |
| Matrix | KS4 Targets > and Difference > rows under each row |
| Comparison Matrix | The whole report, which needs a second data set |
| P8 Overview | KS4 Targets > and Difference > rows under each pupil, and A8 Pts (Diff) in the Sort : list |
| SPI Scattergraph | Comp. A8 and Comp. SPI for the pupils at a point |
| Colour | Meaning |
|---|---|
| 52.87 ↑ light green, up arrow | Higher than the other data set’s figure |
| 40.30 ↓ pink, down arrow | Lower than the other data set’s figure |
| No colour | The same |
In the demo school, the Y10 Summer collection’s Attainment 8 of 40.30 is pink against the KS4 targets’ 52.87, which is light green. Compare grades that mean the same kind of thing, such as end-of-course predictions with end-of-course targets.
Some equal figures in the demo school are still coloured. An average KS2 score of 104 shows pink against 104, so read the numbers as well as the colours.
On Track filters
Section titled “On Track filters”The On Track panel narrows the report to grades above, on or below each pupil’s expected grade for the term. The expected grades come from your school’s Expected Attainment Pathways (EAPs).
| Option | Shows |
|---|---|
| All | Every grade. The default |
| Above Track | Grades higher than expected |
| On Or Above | Grades on or higher than expected |
| On Track | Grades equal to the expected grade |
| Below Track | Grades lower than expected |
On Track uses each pupil’s best grade in a qualification, not the first entry the headline measures use. As its question mark puts it, On Track “will always use the best grade for the student”. Bear this in mind if you use it with headline figures.
In Headlines reports the panel stays greyed out until you choose a qualification on Options. Pupils with no expected grade are left out. In the demo school’s Y10 Summer collection, Below Track in the maths Grade List leaves 155 of the 210 pupils.
On, above and below track explains how Sisra compares grades.
The toolbar
Section titled “The toolbar”The grey toolbar sits above the report. Your school’s administrator sets the starting value of three of its controls for everyone, in CONFIG: see KS3/4 Report Settings.
| Control | What it does | Default |
|---|---|---|
| Sort : and the A to Z arrow | Sorts the rows by a column, in either direction | Name |
| Count : or Percentage : (abacus and % icons) | Shows counts or percentages in the columns with an orange line above their headings | Count |
| Standard : or Cumulative : (two chart icons) | Shows single grades, such as 7, or ranges from the top grade, such as 9 - 7 | Standard |
| Sub : (a quartered circle for Sub and a plain circle for Whole) | Decides whether sub-grades count when grades are compared | Sub |
| Breakdown : | Splits each figure by the values of one filter | None |
| GAP | Shows whether the report adds GAP rows | OFF |
Choose a column in Sort :. The arrow beside it switches between ascending and descending order. For example, sort the maths Grade List by EAP Diff (sub) to put the pupils furthest below their expected grade together.
Count and Percentage
Section titled “Count and Percentage”The abacus shows counts and the % sign shows percentages, and the label changes from Count : to Percentage :. Percentages are of the row’s total, so in the Grades Overview they are shares of the qualification’s grades, not of the cohort. Percentage also lets GAP rows appear in the Grades reports.
Standard and Cumulative
Section titled “Standard and Cumulative”Cumulative turns grade columns into ranges from the top grade down, such as 9 - 5 %. In the 25/26 leavers’ exam results, maths shows 61.0% at 9 - 5 and 83.8% at 9 - 4. Grades reports shows an example.
Sub and Whole
Section titled “Sub and Whole”Sub-grades are the +, = and - after a grade, such as 5+. With Sub, a 5+ counts as better than a whole grade 5. With Whole, the two count as equal. The toggle changes three things:
- Compare
- the tracker
- On Track, and the above, on and below track figures
It does not change points. In the demo school, Fairbrother; Connor’s Y10 Summer maths grade is 3- and his KS4 target is 3. With Sub his grade is below the target. With Whole the two are equal.
Breakdown and GAP
Section titled “Breakdown and GAP”Breakdown : splits each figure by the values of one filter, beneath the figure for everyone. With Disadvantaged, the Headlines Summary shows All, Disadvantaged and Non Disadvantaged for each measure. Each group’s figure is coloured against All, with a curved arrow: light green where it is higher, pink where it is lower.
When the filter has two values, some reports add a GAP row: the first group’s figure minus the second’s. The GAP badge reads ON, in green, when it applies and OFF when it does not. It reads N/A, in grey, where it cannot apply, such as at Students level. GAP rows appear in:
- the Headlines Summary
- the Grades Overview and Totals at Faculties, Qualifications and Classes level, with Percentage selected
In the 25/26 leavers’ exam results, disadvantaged pupils’ average Attainment 8 is 47.33 and other pupils’ is 52.23. The GAP is 47.33 − 52.23 = −4.90.
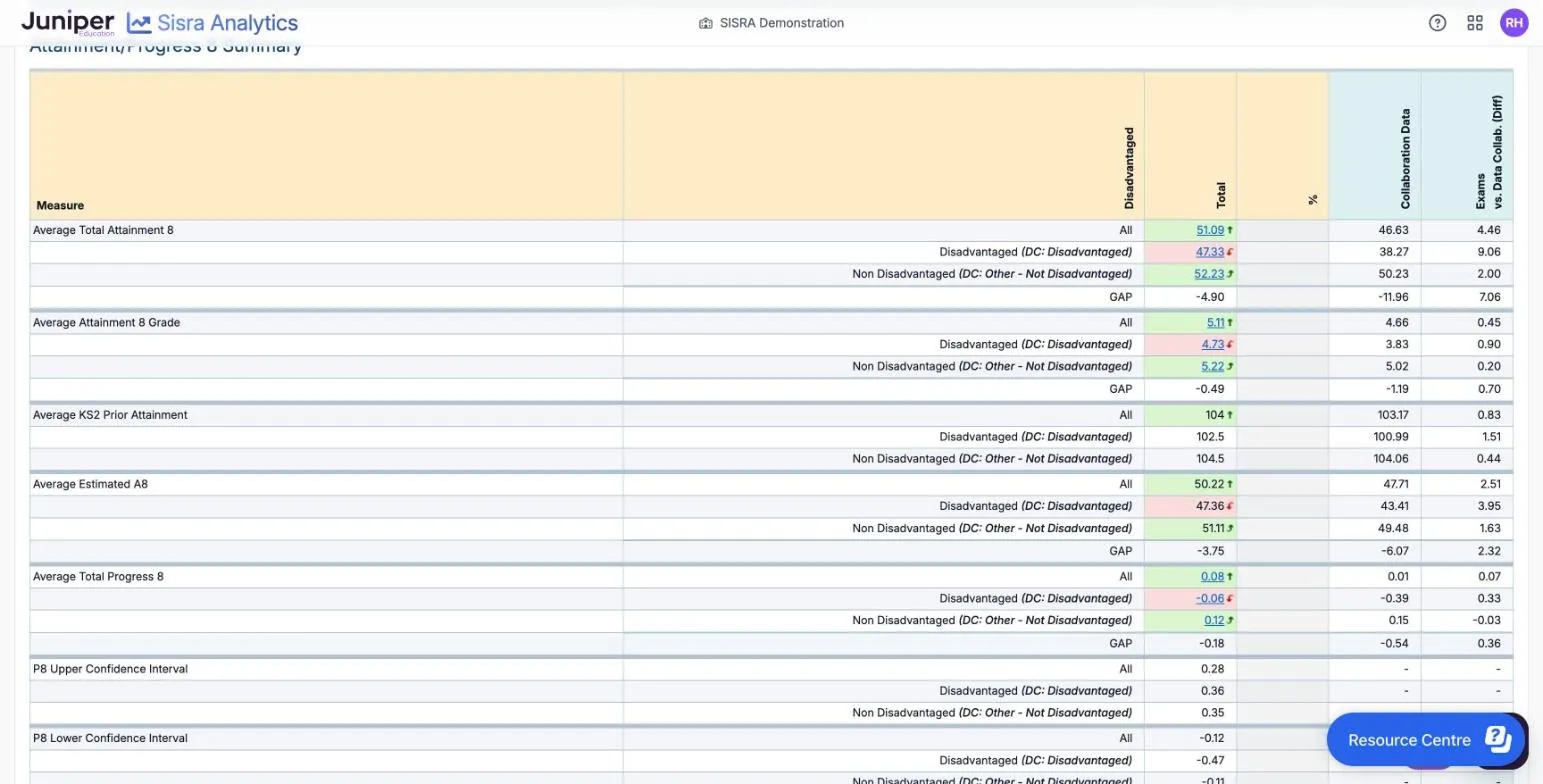
A small blue diamond in the Breakdown : list marks your key filters: in the demo school, Disadvantaged, Gender and SEN. With one of these, the collaboration columns show the same group in other schools, such as “DC: Disadvantaged”. See Like-for-like comparisons.
At Students level, a breakdown adds a column instead of rows. At other levels, Breakdown : lists only filters with 15 values or fewer.
Key Characteristics
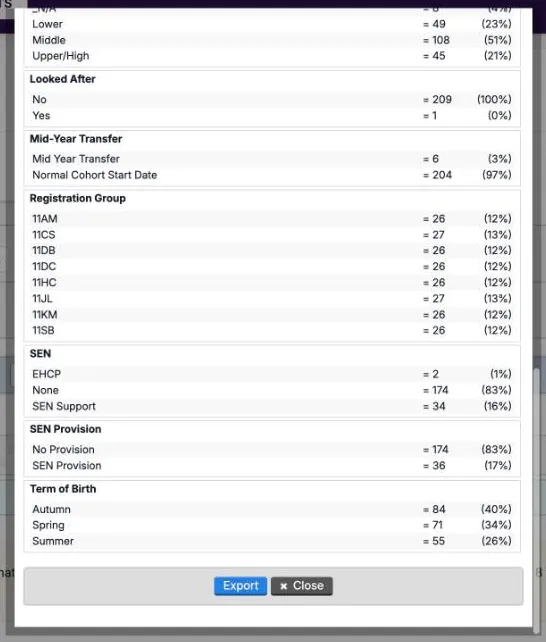
Section titled “Key Characteristics”The key icon opens Key Characteristics. For each filter, it gives the number and percentage of pupils in the report with each value. The number on the icon is the count of pupils in the report.
It follows the report’s options and filters, so it can describe one class, a group or the pupils in a measure. In the 26/27 cohort, it shows 210 pupils On Roll and none as Guest. Of them, 49 (23%) are disadvantaged and 7 (3%) have English as an additional language. Inside a report, Export saves it and Close closes it.
Pin This Report
Section titled “Pin This Report”Pin This Report remembers the report you are on, with its options and filters. Return to Pin then reloads it exactly as it was, and the cross beside it clears the pin. Use it before you follow links from a report, such as from the Headlines Summary to lists of pupils, so that you can get back.
You can pin one report at a time, and a new pin replaces the old one. The pin clears when you:
- change the Main Focus or Compare data set
- switch between View, Project and Track
- go to the REPORTS home page
- sign out
Drill down to pupils
Section titled “Drill down to pupils”Blue, underlined figures and names are links:
- a count or average opens the pupils behind it, such as the 202 pupils in Pupils Included (Progress 8 Coverage)
- a pupil’s name opens their Student Detail report
- a faculty opens its qualifications, a qualification its classes, and a class its Grade List
- a count in a matrix lists the pupils in that cell
Links lead only to levels your authority group can open.
Question-mark help
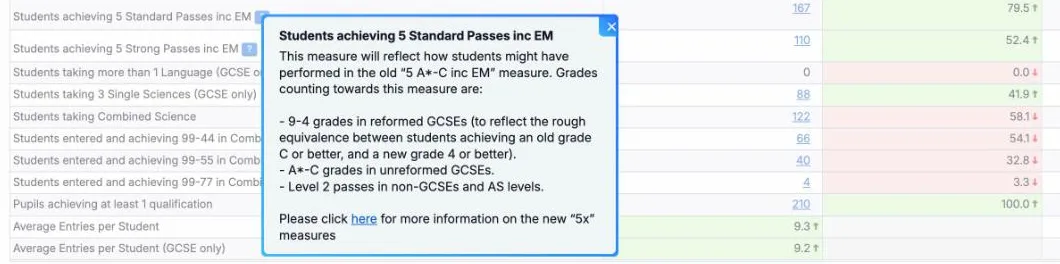
Section titled “Question-mark help”A blue question mark beside a measure, column heading or option explains it, often with how it is calculated. For example, the one beside Students achieving 5 Standard Passes inc EM lists the grades that count.
Legends and icons
Section titled “Legends and icons”Below most reports, KS3/4 Legend explains the icons beside pupils and grades, and Data Collaboration Legend explains the collaboration colours and warnings. The colour scale and warning triangles covers the second.
| Icon | Meaning |
|---|---|
| Green star | The grade can count towards the headline measures |
| Grey star | The grade cannot count, for example because the qualification is unapproved |
| Red down arrow | The grade is discounted |
| Red 3 | The grade is not among the pupil’s best three non-GCSE grades, so it cannot count |
| @ | A resit |
| Person | A guest, left out of the cohort’s headline figures |
| Target | A member of the cohort’s default focus group, highlighted so that staff can pick them out |
| Adj | The pupil’s Progress 8 score has been adjusted |
The stars and the red arrow appear in Eligibility columns. They show whether the grade counts in the headline measures, which follow the DfE’s rules for first entries and discounting.
Coloured tags under pupils’ names, such as Disad, ATT and HPA, are your school’s own tags for filter values. Point to one to see its filter: in the demo school, HPA is “KS2 Banding: Upper/High”. Highlight groups with tags explains how they are set up.

The colours in this guide are those of the Red/Green Theme, the default. Your school can choose another theme for tables and charts: see Colour Theme.
Print and export
Section titled “Print and export”| Control | Where | What it does |
|---|---|---|
| The printer icon at the top right of a report | Opens your browser’s print window, where you can also save the report as a PDF | |
| Export To Excel | The Excel icon at the top right of a report | Downloads the report as a spreadsheet, with its publishing details and the options chosen |
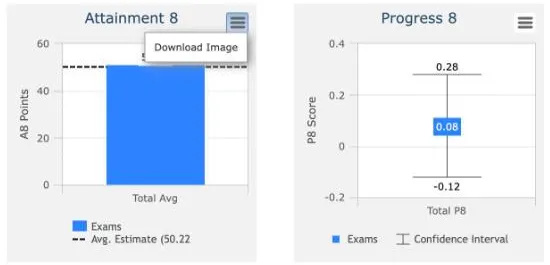
| Download Image | The menu (three lines) on each chart | Saves the chart as an image |
| Export | Key Characteristics, inside a report | Downloads the counts in Key Characteristics |
| Export Table Data, Export All Headlines | The trends reports | Export the trends tables |
Each report prints on its own. If the colours do not print, turn on background graphics in your browser’s print settings, such as Background graphics in Google Chrome. On the Headlines Dashboard, Track and the export icon are greyed out: save each chart with Download Image instead.
Exports and printouts hold personal data about pupils. Store, share and delete them as your school’s data protection policy says. Export published data covers the broadsheets on the reports home.
Options that stay set
Section titled “Options that stay set”Sisra keeps your options, filters, comparisons and tracker choices, for you alone. They stay set as you move between reports and areas, and the next time you open the reports, for up to 48 hours. So a filter you set yesterday may still be on: check the tabs for green numbers before you read a figure.
To clear your choices:
- on one tab, select the reset arrow on the tab
- on every tab, select All and its reset arrow, then Yes in Reset All Tabs?
The Reset All Tabs? question disappears after a second or two, so select Yes straight away. After a reset, each option goes back to your school’s default.
If you open the KS3/4 reports in a second browser tab, Sisra warns that multi-tabbing is supported “although there are some limitations to the functionality”.