


 Sonar Tracker
KS3/4 reports
Basics, EBacc, value added and AtL reports
Four smaller areas take one measure at a time down to groups and pupils. Basics covers English and maths, and EBacc the English Baccalaureate (EBacc). VA covers the EBacc value added (VA) measures, and AtL your school’s Attitude to Learning (AtL) judgements.
Where to find them: select Basics, EBacc, VA or AtL on the area bar, then a report and a level.
Who can see them: the Filters, Faculties, Qualifications and Classes levels need View Qualification Report, and the Students level needs View Student Report. Admin and User have both by default.
Basics, EBacc and VA need a data set published with Headlines on and a DfE Rules from: year. At least one qualification also needs a Special, such as Maths, on the Qualification Matching page: see Match qualifications in KS3/4. AtL needs AtL judgements in the data set, for pupils who also have a grade in that qualification. Otherwise the area is greyed out, and its question mark says why.
The examples use the demo school’s 25/26 leavers’ Exams and the 26/27 cohort’s Y10 Summer predictions. The demo school’s KS2 scores for 25/26 are not official, so the KS2 and value added figures for that cohort are not the DfE’s.
Basics
Section titled “Basics”The Contribution report shows who reaches grade 5 or above, and grade 4 or above, in English and maths. It works at Filters, Faculties, Qualifications, Classes and Students level. It uses the grades that count in the headline measures: first entries, after discounting. English and maths explains the measure.
Read the report
Section titled “Read the report”| Column | What it shows |
|---|---|
| Stu Count | The number of pupils in the row. At Qualifications level, the pupils who take the qualification |
| KS2 Eng, KS2 Mat | Their average KS2 English reading and maths scores |
| Eng Qual, Mat Qual | At Students level, the English or maths qualification that counts. N/A at other levels |
| Eng Points, Mat Points | The points in that qualification, or their average |
| Eng 9-5, Eng 9-4 | Grade 5 or above, and grade 4 or above, in English: Y or N for a pupil, and a count for a group |
| Mat 9-5, Mat 9-4 | The same for maths |
| Basics 9-5, Basics 9-4 | Grade 5 or above, and grade 4 or above, in both English and maths |
The columns with an orange line above them switch between counts and percentages with Count : and Percentage :. Counts are links to the pupils.
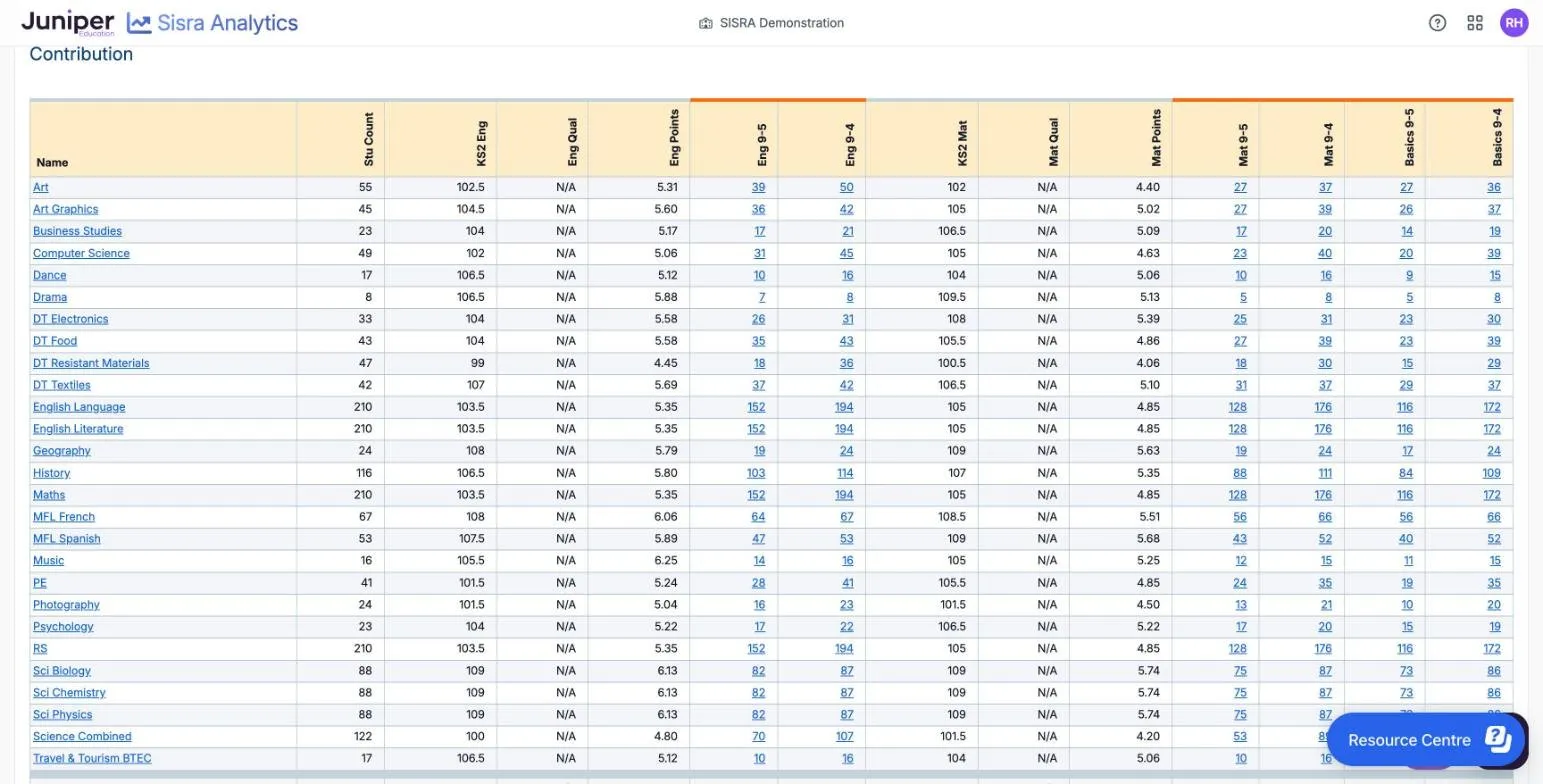
At Qualifications level, each row covers the pupils who take that qualification. It shows their English and maths results, not their results in the qualification itself. In the 25/26 leavers’ results, the Maths row holds all 210 pupils:
- 152 have grade 5 or above in English and 128 in maths
- 116 have grade 5 or above in both, and 172 grade 4 or above in both
These match the Headlines Basics 9-5 and Basics 9-4 tables. The History row has 116 pupils, and 84 of them have grade 5 or above in both. That is 84 ÷ 116 = 72.4%, against 55.2% for the whole cohort.
Points to watch
Section titled “Points to watch”For English, one of English language or English literature at the grade is enough. Pupils appear in the row of every qualification they take, so the rows overlap and do not add up to the cohort.
To list pupils with grade 5 or above in English but not maths, use the Measures tab: see Measures.
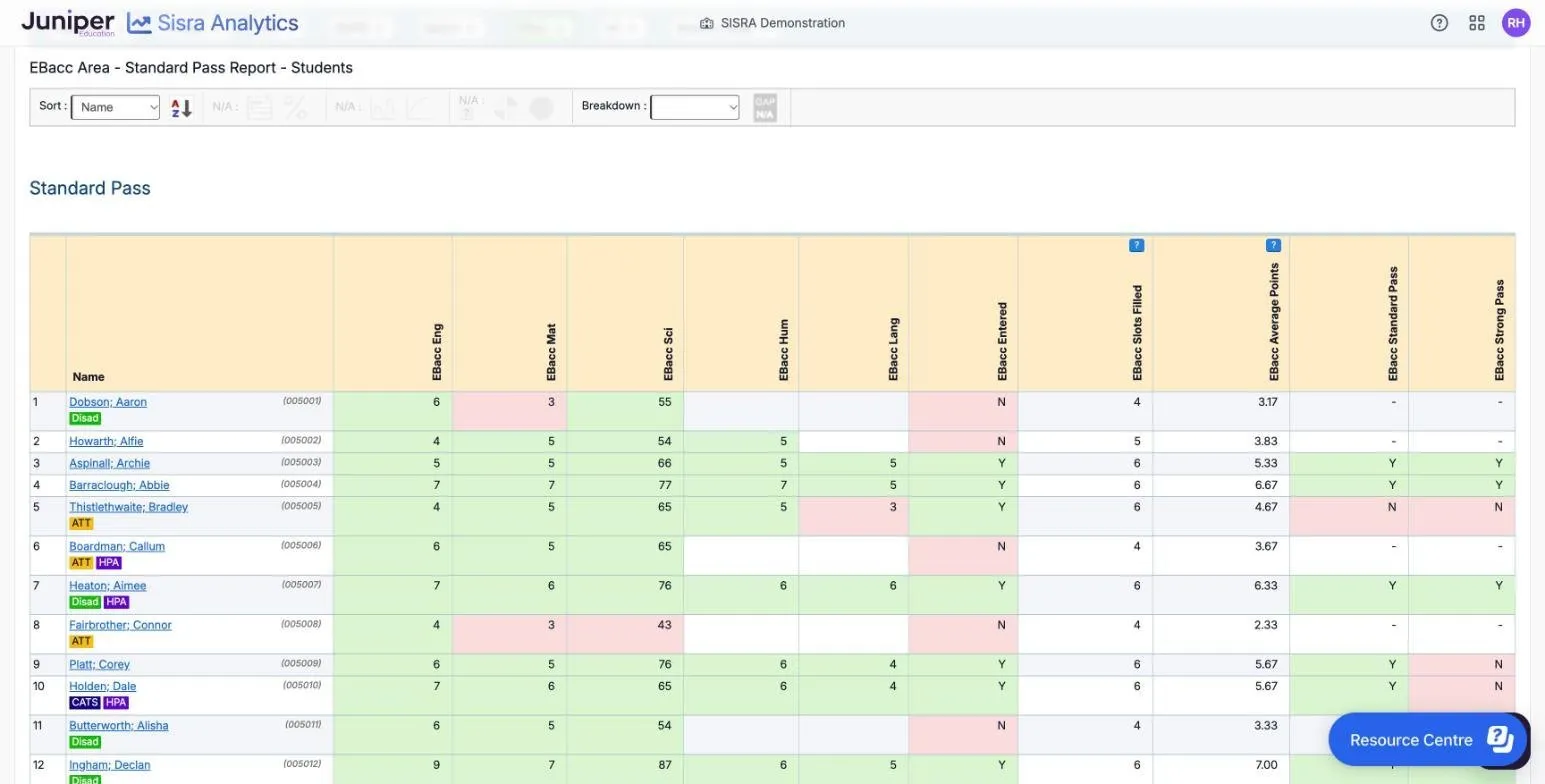
The Standard Pass and Strong Pass reports show EBacc entry and achievement, at Filters and Students level. They have the same columns. Standard Pass applies grade 4 or above in each element, and Strong Pass grade 5 or above. EBacc explains the rules.
Read the report
Section titled “Read the report”| Column | What it shows |
|---|---|
| Stu Count (Filters level) | The number of pupils with the filter value |
| EBacc Eng, EBacc Mat, EBacc Sci, EBacc Hum, EBacc Lang | At Students level, the pupil’s grade in each element, with both science grades. At Filters level, the number of pupils who pass that element |
| EBacc Entered | Whether the pupil is entered for the EBacc, or how many pupils are |
| EBacc Slots Filled | The EBacc slots filled, out of 6, because science fills two |
| EBacc Average Points | The EBacc average point score (APS): the points in the six slots ÷ 6 |
| EBacc Standard Pass, EBacc Strong Pass | Whether the pupil achieves each pass, or how many pupils do |
In the 25/26 leavers’ results, 87 pupils are in the attendance group 2. 95% - 99%. Of them, 68 are entered for the EBacc, 58 achieve the standard pass and 39 the strong pass. They fill 5.61 EBacc slots on average, with an average point score of 5.21.
Across the whole cohort, 119 of the 210 pupils (56.7%) are entered, 100 (47.6%) achieve the standard pass and 62 (29.5%) the strong pass. In the 26/27 cohort’s Y10 Summer predictions, 119 are entered, 58 (27.6%) are predicted the standard pass and 7 (3.3%) the strong pass.
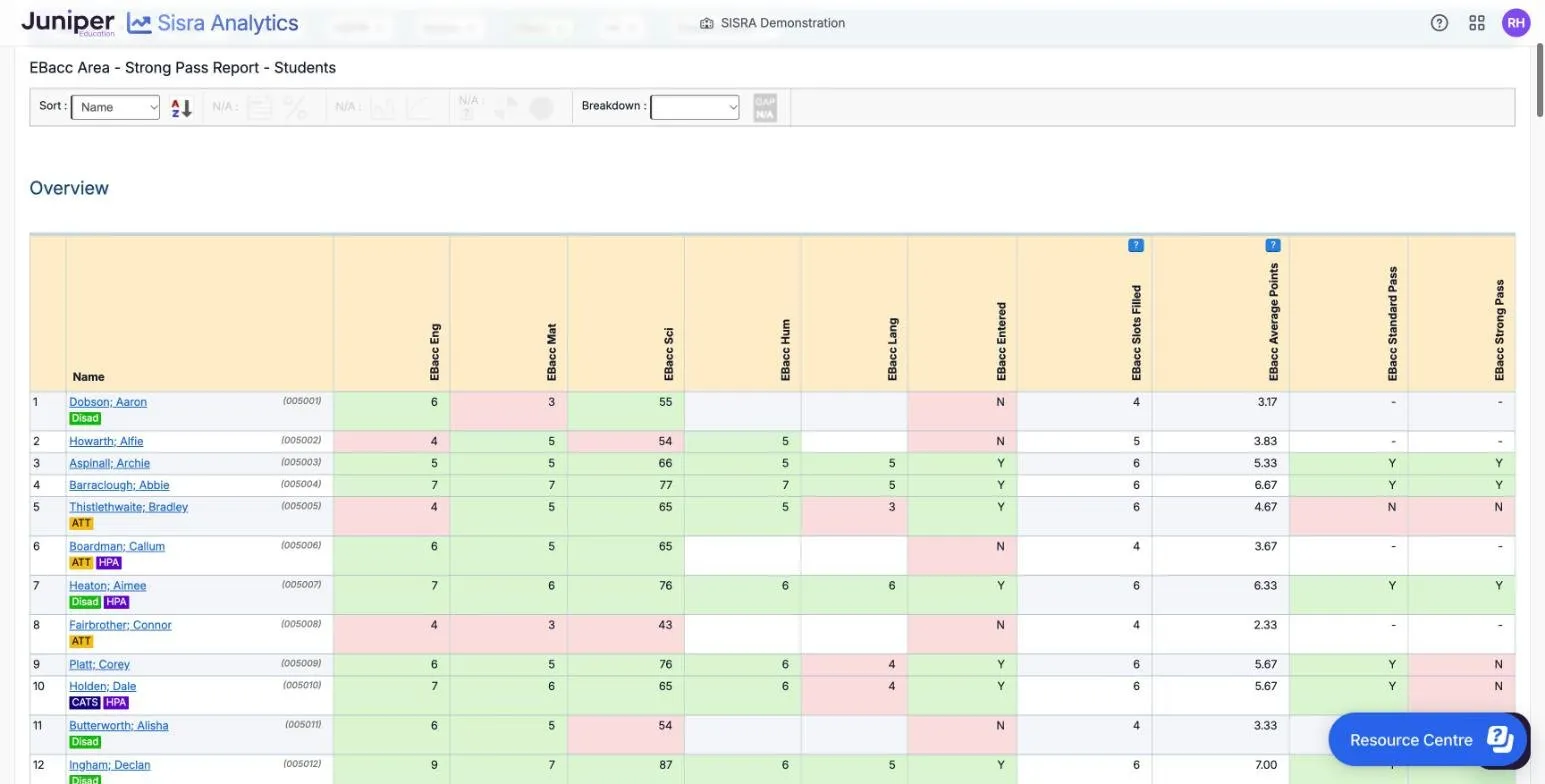
At Students level, an element’s grade is green at the pass grade or above and pink below it. The pass grade is 4 in Standard Pass and 5 in Strong Pass. In EBacc Entered and the pass columns, Y is green and N pink.
Points to watch
Section titled “Points to watch”Sisra Analytics still reports the EBacc. The DfE announced on 4 November 2025 that the EBacc is leaving its headline accountability measures. Its response to the KS4 consultation was still awaited on 15 October 2026. Do not present the EBacc figures as a target.
A pupil counts as entered only with an entry in every element. That means English language and English literature, maths, combined science or three of biology, chemistry, physics and computer science, a language, and history or geography. So a pupil without English literature is not entered, whatever their other grades.
The Strong Pass report’s table heading reads Overview, although its title names the report.
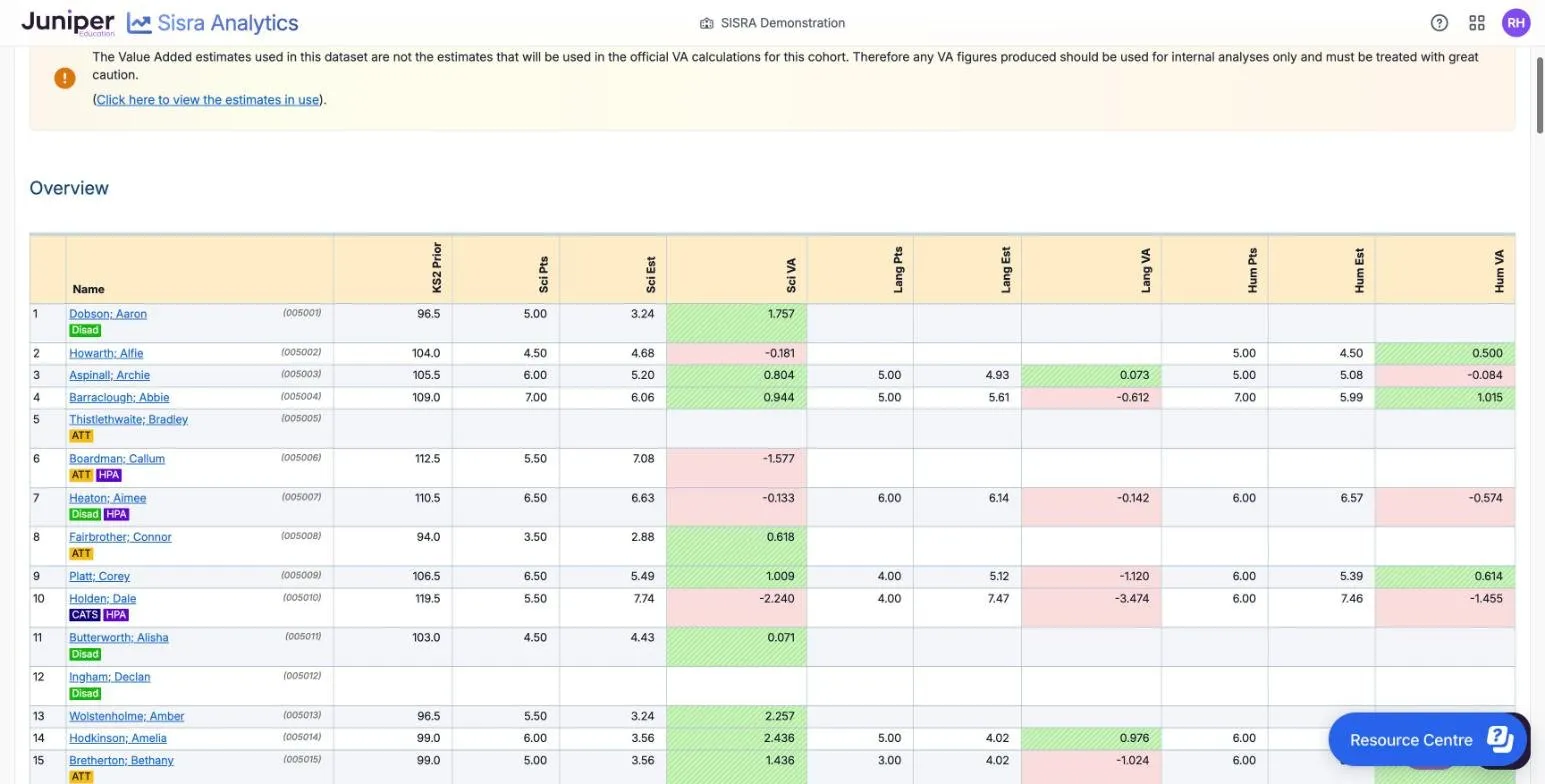
The Overview shows EBacc value added in science, languages and humanities, at Filters and Students level. A pupil’s value added in each is their points minus the estimate for pupils with the same KS2 score. The estimates are the set chosen in VA Estimates: when the data set was published. EBacc value added explains the calculation.
Read the report
Section titled “Read the report”| Column | What it shows |
|---|---|
| KS2 Prior | The pupil’s KS2 prior attainment |
| Sci Pts | The average points of the pupil’s two science grades |
| Lang Pts, Hum Pts | The points of the pupil’s best language, and best history or geography grade |
| Sci Est, Lang Est, Hum Est | The value added estimate for the pupil’s KS2 score |
| Sci VA, Lang VA, Hum VA | Points minus estimate |
Two orange banners appear when the estimates are not the ones the DfE will use for the cohort. The second says the same for value added as the first says for Progress 8: the figures are “for internal analyses only”.
In the 25/26 leavers’ results, the summary row gives:
- science: 5.06 points against an estimate of 5.00, value added 0.052
- languages: 5.04 points against 5.54, value added −0.495
- humanities: 6.04 points against 5.38, value added 0.654
The report works out value added before rounding, so 5.06 − 5.00 shows as 0.052 rather than 0.06. The 26/27 cohort’s Y10 Summer predictions use the DfE’s 2024 estimates. Their value added is −0.454 in science, −0.814 in languages and −0.537 in humanities.
At Students level, value added above 0 is green and striped, and below 0 pink.
Points to watch
Section titled “Points to watch”A pupil counts in an element only if they have a KS2 score and an entry in it. In the 25/26 results, 202 pupils count in science, 113 in languages and 133 in humanities, so compare the elements with care. The Headlines Summary gives each element’s coverage and confidence limits. In the demo school, the Y10 Summer science value added has no confidence limits, shown as -.
The Overview counts the Attitude to Learning judgements in one category, such as Attitude, for the pupils in each row. It works at Filters, Faculties, Qualifications, Classes and Students level. Your school sets up its categories and judgements: see Set up Attitude to Learning.
Options
Section titled “Options”| Option | What it does | Default |
|---|---|---|
| AtL Category, on the AtL tab | Chooses the category. Until you choose one, the report says “Please select an Attitude to Learning Category” | None |
| Add AtL Filters | Narrows the report to grades with chosen judgements in any category | None |
| Count : or Percentage : | Counts or percentages of judgements | Count |
| Qualification | Needed at Classes level | None |
On Track and Key Characteristics stay greyed out until you choose a category.
Read the report
Section titled “Read the report”| Column | What it shows |
|---|---|
| A column for each judgement, such as Excellent, Good, Satisfactory and Poor | The number of each judgement. The columns take your school’s names for its judgements |
| Unknown Judgement | Values that match no judgement in the category |
| Judgement Count | All the judgements in the category, including unknown ones |
| No Judgement | Grades with no judgement in this category |
| The category’s average, such as Average Attitude | The average judgement, average points or total points, as your school set up the category |
| Residual | How the judgements compare with the same pupils’ judgements in their other qualifications |
An average judgement shows as a letter in the judgement’s colour. In the demo school, A is blue, B green, C orange and D red. Residual cells are green above 0 and pink below.
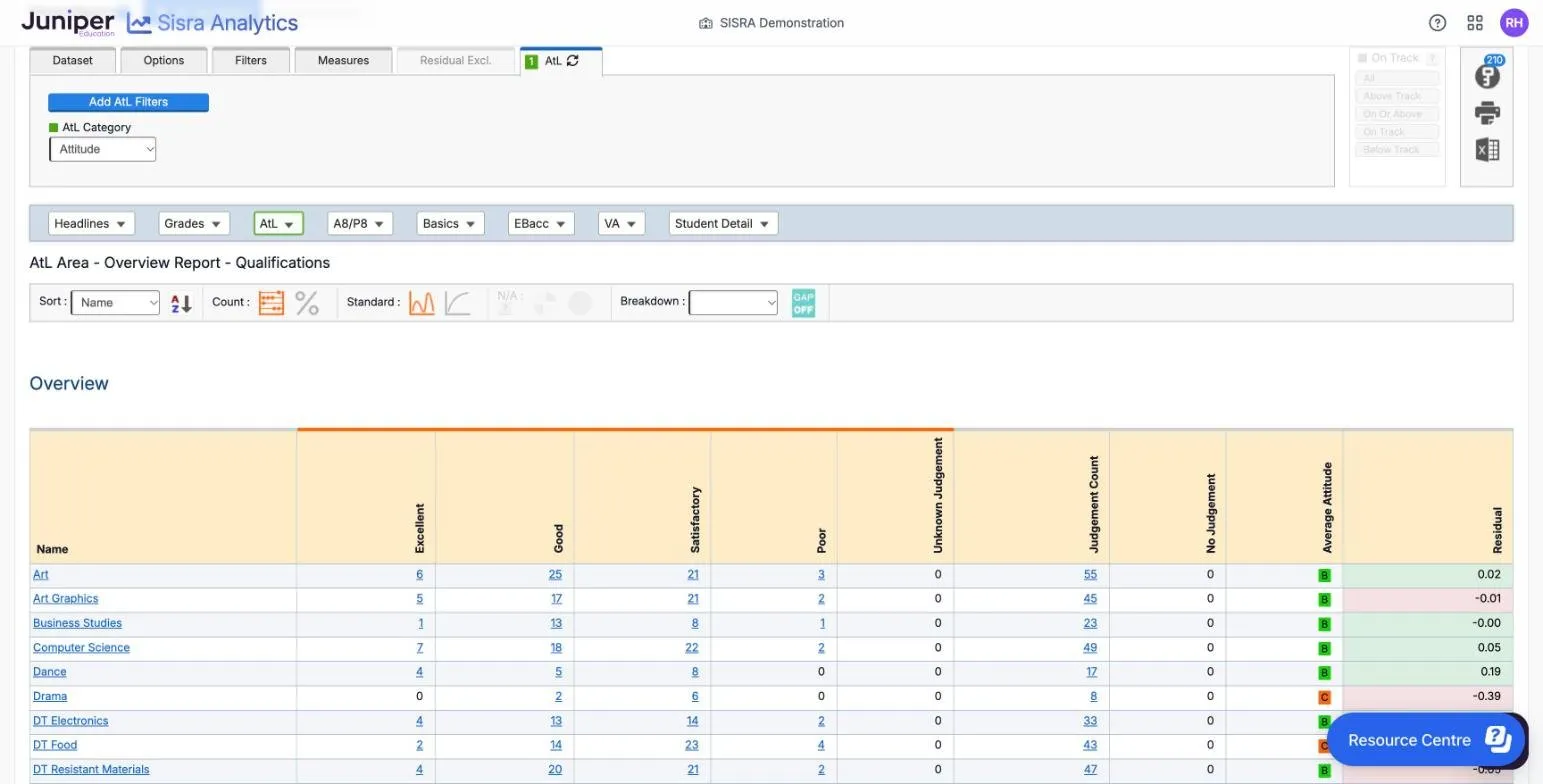
In the demo school, Attitude has four judgements, Excellent to Poor, worth 4 to 1 points and shown as A to D. In the 26/27 cohort’s Y10 Summer collection, art has 6 Excellent, 25 Good, 21 Satisfactory and 3 Poor: 55 judgements. Their average is (6 × 4 + 25 × 3 + 21 × 2 + 3 × 1) ÷ 55 = 144 ÷ 55 = 2.62 points. That is nearest to Good, so it shows as B.
Drama has 8 judgements, 2 Good and 6 Satisfactory, averaging 2.25 points, so it shows C. Its residual is −0.39: drama pupils’ attitude in drama is about 0.4 points below their attitude in their other subjects. Across all qualifications there are 1,969 judgements, averaging B.
Points to watch
Section titled “Points to watch”A judgement appears only with a grade. If a pupil has a judgement but no grade in that qualification, the report leaves the judgement out.
Many rows are small. Drama’s 8 judgements come from 8 pupils, so one pupil moves its average a long way. Treat a residual close to 0 as 0: in the demo school, business studies shows −0.00 in green.
Project does not project AtL judgements.