


 Sonar Tracker
How Sisra works
How Sisra calculates the KS5 measures
Sisra Analytics works out each sixth form student’s measures when a KS5 data set is published with headlines. This page explains who counts, how attainment and value added are calculated and how the other measures work, with worked examples you can check. It also compares each measure with the DfE’s.
Sisra’s measures and the DfE’s
Section titled “Sisra’s measures and the DfE’s”On 1 September 2026 the DfE renamed its “16 to 18” performance measures “16 to 19”. Sisra’s screens say KS5. The DfE’s 16 to 19 technical guidance (September 2026) sets out the headline measures for students completing in 2025 to 2026. They are value added, attainment, retention, English and maths progress, and destinations.
| DfE measure | In Sisra | Notes |
|---|---|---|
| Level 3 value added | Value Added report, and value added in Headlines | An internal estimate until national data for the cohort’s own year is in use |
| Attainment: average points per entry | Headlines and Performance Cohorts | Also shown as an average grade |
| Best 3 A levels, and grades AAB or better | Best 3 A Levels and Headlines | The DfE still publishes both |
| English and maths progress | Eng/Mat Progress | Needs prior English and maths baselines |
| T Level attainment | Headlines | No value added, as with the DfE |
| Retention | Not calculated | |
| Destinations | Not in Sisra | Published by the DfE from its own matched data, two years later |
Headline figures come only from data published with Headlines on. Publishing grades also works out which students count, so republish every KS5 data set after you change statuses.
Who counts
Section titled “Who counts”Each student’s status decides whether they count in the headline figures:
| Status | Counts |
|---|---|
| On Roll Aged 18, Year 12 Addback, Year 13 Only Aged 18 | Yes |
| On Roll, Year 12 Only, Year 13 Only | Only with at least two qualifications each the size of an A level or more, or one at least twice that size |
| Guest | No, but included in figures for individual students |
| Left School | No |
The DfE counts students of academic age 16, 17 or 18 at the start of the academic year. It finds school sixth form students through the spring census. Check cohorts against the spring census explains how to keep statuses in line with it.
Performance cohorts
Section titled “Performance cohorts”The DfE groups qualifications into performance cohorts. A student counts in a cohort if they have at least one approved qualification in it. Sisra takes each qualification’s cohort from its qualification number (QN) on the Matching page.
| Cohort | Qualifications | Value added in Sisra |
|---|---|---|
| A Level | A levels and AS levels | Yes |
| Academic | A levels, AS levels and other academic qualifications, such as the Extended Project | Yes |
| Applied General | Approved applied general qualifications | Yes |
| Tech Level | Approved tech levels | Yes |
| L3 Overall | All approved level 3 qualifications. This is Sisra’s own cohort, which the DfE does not report | Yes |
| Tech Cert | Approved level 2 technical certificates | No |
| T Level | T Level core and occupational specialism | No |
A conditionally approved qualification counts only if the student also has an approved qualification in the same cohort.
Attainment: points per entry and average grade
Section titled “Attainment: points per entry and average grade”Average points per entry is a cohort’s total points divided by its total entries. Entries are counted in A level sizes: an A level is 1 entry and an AS level half an entry. The points come from the DfE’s performance points guide (August 2026). An A level is worth 60 points for an A* down to 10 for an E. An AS level is worth 25 for an A down to 5 for an E.
Sisra also shows each average as a grade, with +, = or - after it, and gives average points per student: total points divided by students. Level 2 technical certificates are averaged separately, with entries counted in GCSE sizes.
Two fictional students show how it works. Leah Brandt took A levels in maths (A*), chemistry (A) and economics (B). Owen Castell took A levels in history (C) and psychology (B), and an AS level in English literature (B).
| Student | Points | Entries |
|---|---|---|
| Leah | 60 + 50 + 40 = 150 | 3 |
| Owen | 30 + 40 + 20 = 90 | 2.5 |
| Both | 240 | 5.5 |
For these two students, the A Level cohort’s average points per entry is 240 ÷ 5.5 = 43.64, which Sisra shows as B+. Their average points per student is 240 ÷ 2 = 120.
The DfE’s guide says T Level points for the 16 to 19 tables “will be shared in due course”. Check the points in your T Level grade methods before you rely on T Level averages.
Value added
Section titled “Value added”Value added (VA) compares each grade with the average result of students nationally who took the same qualification and had similar KS4 results. A positive score means the student did better than similar students nationally. Sisra shows value added in grades: +1.00 is one grade above expectation in an A level.
KS4 prior attainment is each student’s KS4 average point score (APS), imported as a core baseline:
- KS4 APS GCSE (A8 Pts), the average of their GCSE results, for A levels and other academic qualifications
- KS4 APS All (A8 Pts), the average of all their KS4 results, for applied general and tech level qualifications
A student with no KS4 prior attainment has no value added. Set up KS5 baselines explains where to find these scores.
| Step | Calculation |
|---|---|
| Expected points | Read from the national data for the qualification at the student’s KS4 score, between the two nearest points on the national line |
| VA points | The grade’s points minus the expected points |
| VA score | VA points ÷ 10 ÷ the qualification’s size in A levels |
| Student VA | The average of the student’s VA scores, weighted by the size of each qualification |
| Cohort VA | The average across the cohort’s grades, weighted by size in the same way |
Leah’s KS4 APS GCSE (A8 Pts) score is 6.30. Suppose the national data for A level chemistry expects 33.0 points at a score of 6.20, and 36.0 at 6.40. Leah’s score is halfway between, so she is expected to get 34.5 points. Her A is worth 50, so her VA points are 15.5 and her VA score is 15.5 ÷ 10 ÷ 1 = +1.55.
Owen’s C in A level history is worth 30, against expected points of 32.7. That is −2.7 VA points, a VA score of −0.27. If these were the cohort’s only grades, its VA would be (1.55 − 0.27) ÷ 2 = +0.64. Leah’s VA scores in her three A levels are +1.55, +0.40 and −0.35. Her own VA is (1.55 + 0.40 − 0.35) ÷ 3 = +0.53.
Which year’s national data
Section titled “Which year’s national data”The DfE works out value added nationally after each year’s results. So for a cohort still in school, the national data must come from an earlier year. Using data from, under Grades > National Data > Value Added, shows the year in use. As at October 2026 the choices are 2025 Revised, 2024 Revised, 2019 Amended and 2018 Amended.
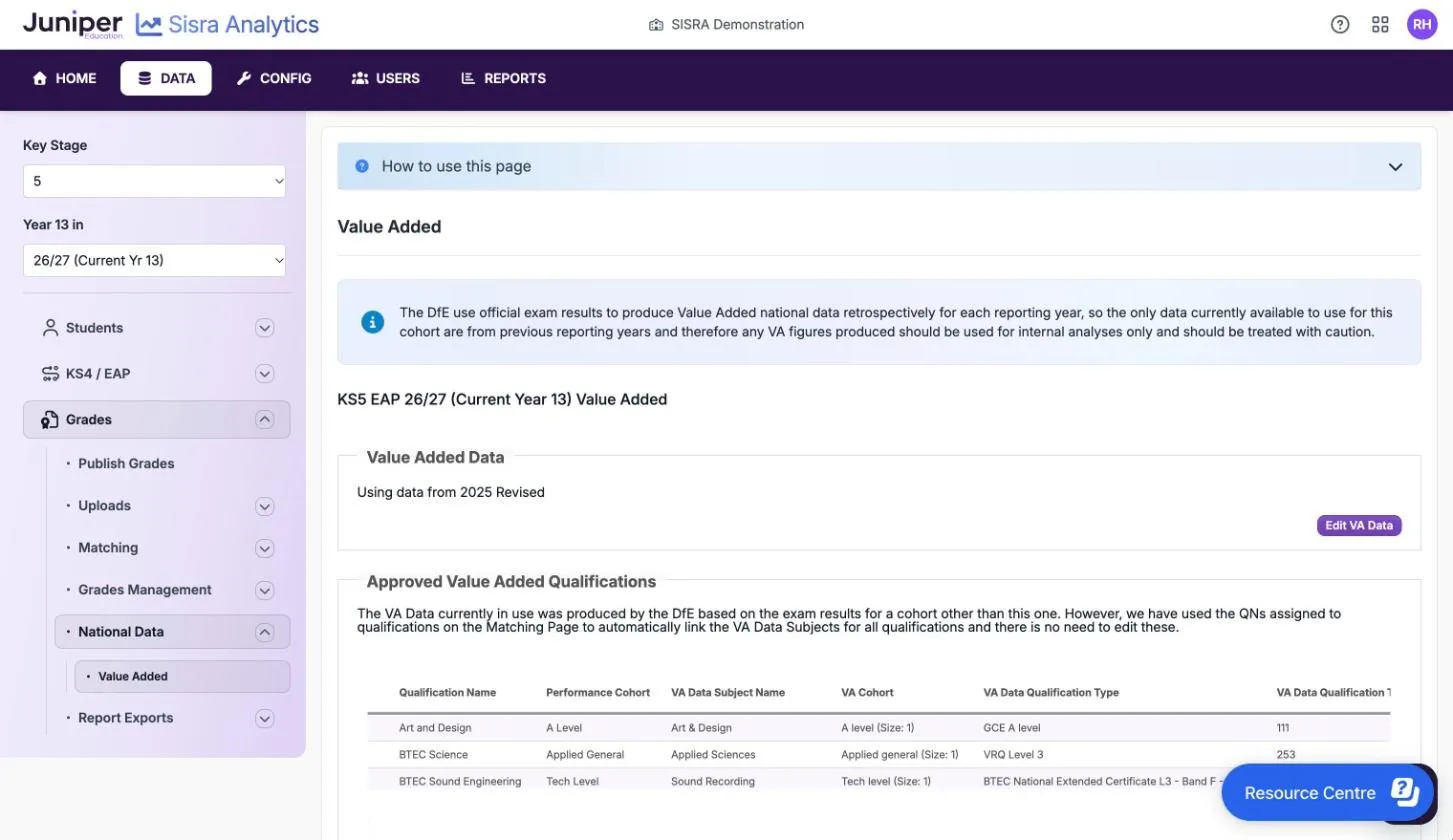
For a leavers cohort, choose the year it was reported in: the 24/25 leavers use 2025. The 25/26 leavers can use 2025 until 2026 data appears in the list. For a current cohort, choose the latest year, and read the results as the screen advises: “for internal analyses only”. Unlike KS4 Progress 8, the DfE publishes level 3 value added for both 2024 to 2025 and 2025 to 2026.
Reading value added
Section titled “Reading value added”Sisra shows value added in grades, while the DfE’s ready reckoner shows it in points: a VA score of +1.55 is +15.5 points. Sisra calculates 95% confidence limits for each qualification, class, faculty, group and cohort. It sets no minimum group size, so a small class has wide limits.
The Value Added report and Headlines use only the grades that count for the school. Grade Analysis uses every grade, so its value added can differ. Sisra also works out unofficial value added for guests, discounted grades and, if you set them up, unapproved qualifications. They do not count in the school’s figures, but Grade Analysis includes them.
Best 3 A levels
Section titled “Best 3 A levels”This measure averages each student’s three best A level grades. A student’s score is the points in their best three A levels divided by 3, even if they took fewer than three. The cohort’s figure is the total for all students divided by three times the number of students, shown as points and as a grade.
A double award A level fills two slots. AS levels, General Studies and Critical Thinking do not count. A student needs at least one full A level to be included. Students with fewer than three A levels can still count. They are left out only if they also take an academic, applied general or tech level qualification the size of an A level or larger.
Leah’s best three are 60 + 50 + 40 = 150, an average of 50, shown as A=. Owen has two A levels, 30 + 40 = 70: his AS level does not count, and it is too small to leave him out. The figure for the two of them is (150 + 70) ÷ (2 × 3) = 36.67, shown as B-.
AAB in facilitating subjects
Section titled “AAB in facilitating subjects”This measure is the share of students with at least AAB in three A levels. At least two of the three must be in the DfE’s facilitating subjects, and a second version needs all three. As at September 2026 the facilitating subjects are biology, chemistry, physics, mathematics, further mathematics, geography, history, English literature, and classical and modern languages. The same students are included as for Best 3 A levels.
Sisra looks for the best three grades of B or above. It keeps the two best A or A* grades first, then chooses facilitating subjects before others.
Leah’s A* in maths, A in chemistry and B in economics give AAB with two facilitating subjects, but not three. Owen’s grades fall short. So 1 of the 2 students (50%) achieves AAB including two facilitating subjects.
English and maths progress
Section titled “English and maths progress”This measure covers students who did not get grade 4 or above in GCSE English or maths by the end of KS4. It shows how much their grade improved in the sixth form, in the DfE’s challenge points. Since 2020 a GCSE grade’s challenge points have equalled the grade: a grade 3 is worth 3.
A student is included if their prior English or maths is worth less than 4 challenge points. Their progress is their best grade’s challenge points minus their prior points, and a student with no grade scores 0 minus their prior points. As the DfE does, Sisra counts any score below −1 as −1. Average English Progress and Average Maths Progress average these capped scores, and the reports also show uncapped scores for internal use.
Ayesha Lund had a grade 3 in GCSE English and got a 4 in her resit: +1. Jas Kerr had a grade 2 and has no grade yet: 0 − 2 = −2, which counts as −1. Their Average English Progress is (1 − 1) ÷ 2 = 0.00.
Students whose prior maths is worth 4 or more fall into a separate measure: whether they achieve an approved level 3 maths qualification. In its 16 to 19 consultation (April to July 2026), the DfE proposed moving the cap from −1 to −2. Its response was still awaited on 15 October 2026.
T Levels
Section titled “T Levels”Sisra counts a T Level as completed when the student passes all three parts: the core, the occupational specialism and the industry placement. It reports the students included and those completing, and average points per entry for the core and the occupational specialism, with their average grades. Neither Sisra nor the DfE calculates value added for T Levels. For 2025 to 2026 the DfE publishes only an attainment measure for them.
Retention
Section titled “Retention”The DfE’s retention measure is the percentage of students retained to the end of their core aim, their main programme of study. Sisra does not calculate it.
How grades count once
Section titled “How grades count once”As with KS4, the KS5 measures give credit for each course once. Qualifications with the same discount code count once: the larger qualification wins, then the one with more points. Sometimes a student passes an AS level but fails the A level in the same subject. Attainment then uses the AS points with the A level’s entry size, while value added uses the A level grade.