


 Sonar Tracker
KS3/4 reports
Attainment 8 and Progress 8 reports
The A8/P8 area takes Attainment 8 (A8) and Progress 8 (P8) down to each pupil. It shows the points in each slot, the estimate for their KS2 score, and their score in each part. Use it to see which pupils, and which parts of Attainment 8, lie behind the headline figures. It has five reports, each at Filters or Students level.
Where to find it: select A8/P8 on the area bar, then a report and a level. Selecting Pupils Included (Progress 8 Coverage) in the Headlines Summary also opens P8 Overview for those pupils.
Who can see it: the Filters level needs View Qualification Report, and the Students level View Student Report. Admin and User have both by default.
The area needs a data set published with Headlines on and a DfE Rules from: year, in grade methods with Attainment 8 points. Otherwise it is greyed out. Attainment 8 and Progress 8 explain how the figures are worked out.
The examples use the demo school’s 25/26 leavers’ Exams. The demo school has KS2 scores for this cohort, but they are not official, so its Progress 8 figures are not the DfE’s. Where the figures for this year’s year 11 help, they come from the 26/27 cohort’s Y10 Summer predictions.
Which estimates the figures use
Section titled “Which estimates the figures use”Progress 8 compares each pupil’s Attainment 8 with an estimate: the average Attainment 8 of pupils with the same KS2 score. The estimates are the set your administrator chose when publishing. It may be the DfE’s official estimates for a year, a Sisra Data Collaboration set, or your school’s own custom estimates. Dataset Info on the reports home, or the i icon on the Dataset tab, names the set.
An orange banner appears when the estimates are not the ones the DfE will use for the cohort. It says that any Progress 8 figures “should be used for internal analyses only and must be treated with great caution”. The DfE publishes each year’s estimates only after that year’s results, so every current cohort has the banner.
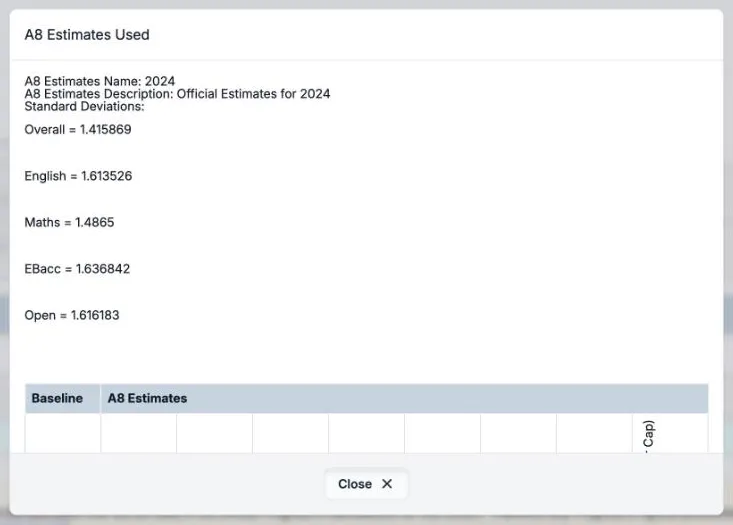
Select Click here to view the estimates in use, at the end of the banner, to open A8 Estimates Used. It shows:
- the set’s name and description, such as “2024” and “Official Estimates for 2024”
- the national standard deviations used for the confidence limits, such as 1.415869 overall
- for each KS2 score from 80.0 to 120.0, in half points, the Attainment 8 estimate and the estimates for each part
- the average numbers of English Baccalaureate (EBacc) and open slots filled, and the Minimum threshold for adjusted Progress 8 (P8 Lower Cap)
In the DfE’s 2024 estimates, a pupil with a KS2 score of 120.0 has an Attainment 8 estimate of 82.030. That is English 16.150, maths 16.710, EBacc 25.020 and open 24.150, and the lower cap is −2.748.
The 26/27 cohort, this year’s year 11, took KS2 tests in 2022, so it has official KS2 scores. Its own estimates will come from the 2027 results. Until then, Juniper Education advises publishing with the DfE’s 2024 estimates: see What returns for 2026 to 2027.
Columns in every report
Section titled “Columns in every report”| Column | What it shows | Summary row |
|---|---|---|
| Name | The pupil, with their Student ID and any tags your school has set up, such as Disad | |
| Stu Count (Filters level) | The number of pupils with the filter value | The cohort |
| KS2 Prior | The pupil’s KS2 prior attainment: the average of their KS2 English reading and maths scores. Blank if they have none | The average |
In a slot, a grade U shows as 0 points and does not fill the slot. A slot with no grade shows as -. Each report ends with a Summary row of averages. Its points average everyone in the report, but its estimates and Progress 8 scores only pupils with a KS2 score.
A8 Overview
Section titled “A8 Overview”A8 Overview shows the points in each of a pupil’s ten Attainment 8 slots.
Read the report
Section titled “Read the report”| Column | What it shows |
|---|---|
| English, Maths | The points in the English and maths slots, doubled where they count twice |
| EBacc 1, EBacc 2, EBacc 3 | The points in each EBacc slot |
| Open 1, Open 2, Open 3 | The points in each open slot |
| Total EBacc, Total Open | The points in the EBacc and open slots together |
| A8 Pts | Attainment 8: English, maths, Total EBacc and Total Open added up |
| Tot Slots Filled | The slots filled, out of 10, with English and maths counting as 2 each when doubled |
In the 25/26 leavers’ results, Dobson; Aaron has:
- 12.00 in English and 6.00 in Maths, both doubled
- 5.00 and 5.00 in EBacc 1 and EBacc 2, and - in EBacc 3, so Total EBacc is 10.00
- 5.00, 4.00 and 3.00 in the open slots, so Total Open is 12.00
- an A8 Pts of 12.00 + 6.00 + 10.00 + 12.00 = 40.00
His empty EBacc slot scores 0, so Tot Slots Filled is 9. Barraclough; Abbie fills all 10 slots, for 14.00 + 14.00 + 21.00 + 21.00 = 70.00.
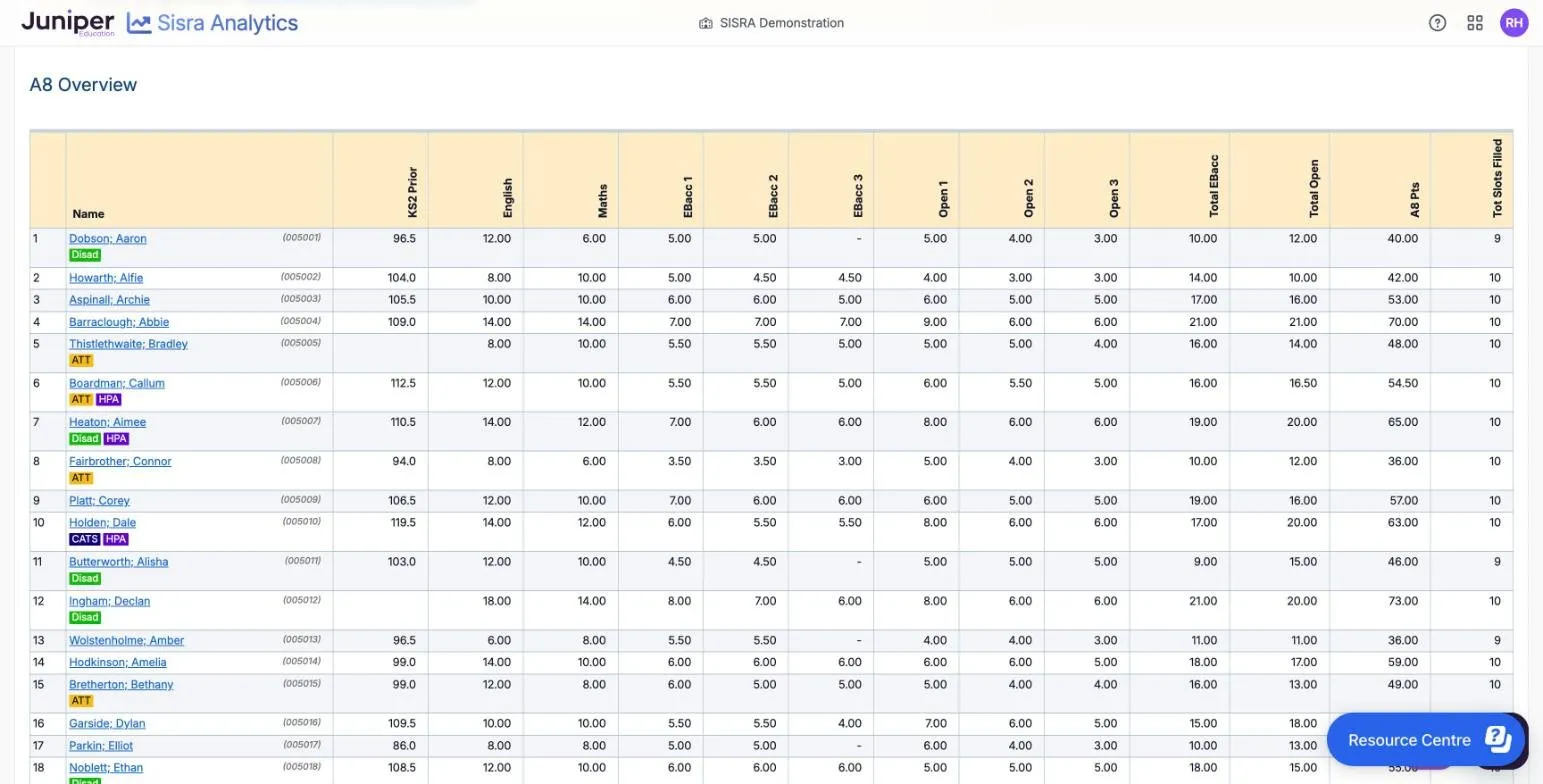
The summary row’s A8 Pts, 51.09, is the same as Average Total Attainment 8 in the Headlines Summary. Its Tot Slots Filled is 9.79.
Points to watch
Section titled “Points to watch”Sort by Tot Slots Filled to find the pupils with empty slots. An empty slot scores 0, and Attainment 8 still divides by 10 for the average grade.
P8 Overview
Section titled “P8 Overview”P8 Overview shows each pupil’s Attainment 8, their estimate, and their Progress 8 overall and in each part.
Read the report
Section titled “Read the report”| Column | What it shows |
|---|---|
| A8 Pts | Attainment 8 |
| Average A8 Grade | A8 Pts ÷ 10 |
| A8 Est | The Attainment 8 estimate for the pupil’s KS2 score |
| Eng P8, Mat P8 | (points − estimate) ÷ 2, for English and for maths |
| EBacc P8, Open P8 | (points − estimate) ÷ 3, for the EBacc and open slots |
| P8 | (A8 Pts − A8 Est) ÷ 10 |
| Tot Slots Filled | As in A8 Overview |
| Colour | Meaning |
|---|---|
| 0.718 green, striped | Above 0: better than pupils with the same KS2 score in the estimates |
| -0.585 pink | Below 0 |
An Adj tag marks a score raised to the minimum for the pupil’s prior attainment group: select it to see the score before adjustment. Pupils with no KS2 score show - for A8 Est and every Progress 8 column. They count in Attainment 8 but not in Progress 8.
In the 25/26 leavers’ results, Dobson; Aaron has a KS2 score of 96.5, an A8 Pts of 40.00 and an A8 Est of 32.82. His P8 is (40.00 − 32.82) ÷ 10 = 0.718, about seven tenths of a grade per slot above the estimate. His English and maths parts are 2.225 and −0.037.
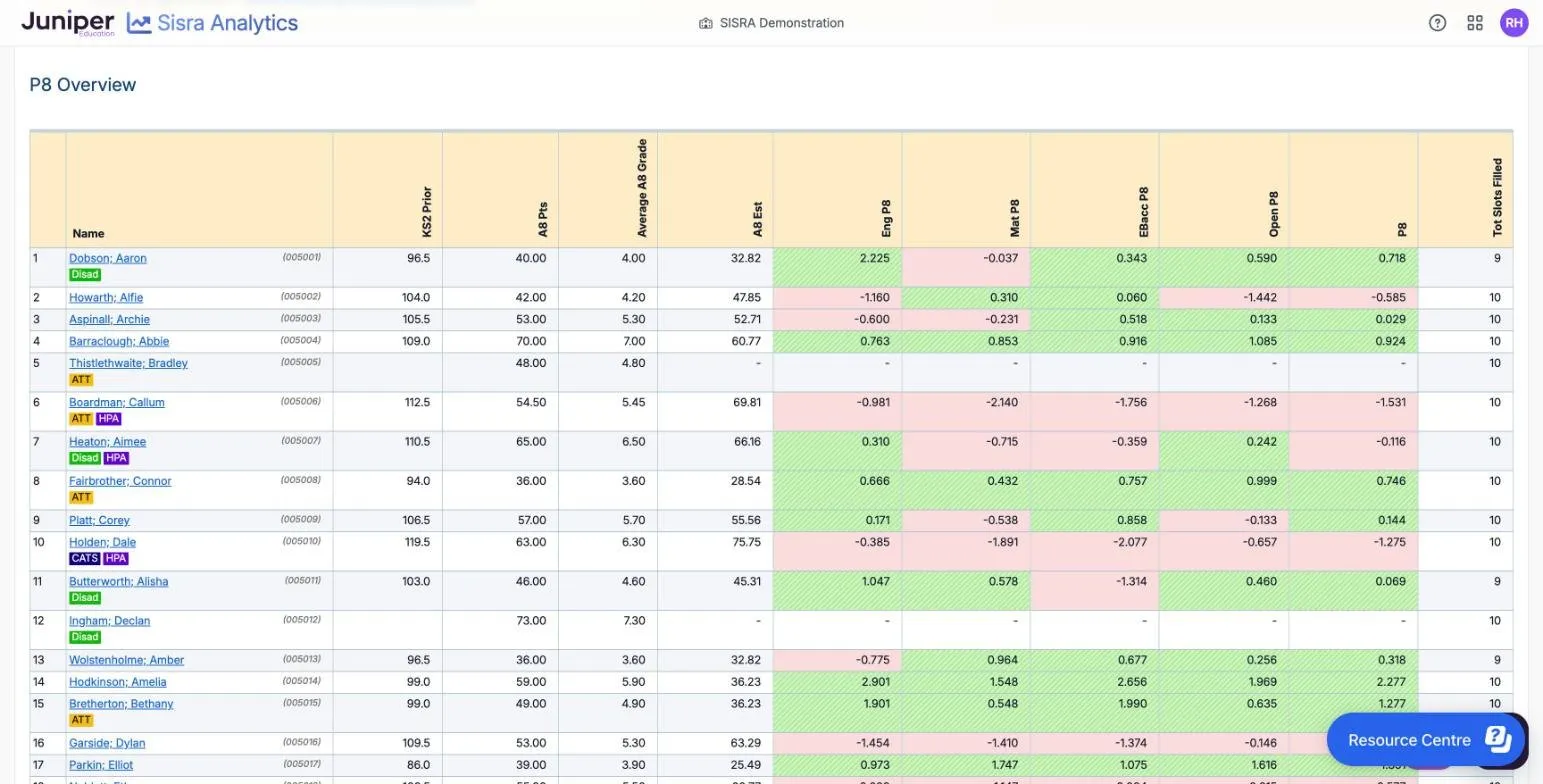
The summary row gives a P8 of 0.081. The parts are 0.035 in English, −0.127 in maths, 0.117 in the EBacc slots and 0.214 in the open slots. The Headlines Summary shows the same, rounded to 0.08.
For this year’s year 11, the 26/27 cohort’s Y10 Summer predictions average 40.30 in Attainment 8 against an average estimate of 46.20. Their Progress 8 is −0.58, on the DfE’s 2024 estimates.
With Compare, each pupil gets a row for the second data set, such as KS4 Targets >, and a Difference > row. Sort : then offers A8 Pts (Diff), to put the pupils furthest from their targets together.
Points to watch
Section titled “Points to watch”The summary row’s A8 Pts averages every pupil, but its A8 Est and P8 average only pupils with a KS2 score. So (51.09 − 50.22) ÷ 10 is 0.087, not the 0.081 shown. Check how many pupils have a - before you compare the averages.
Only the overall P8 is adjusted. The part scores never are, and custom estimates have no minimums: see Adjusted scores.
A Progress 8 score for one pupil, or one class, is a reason to look at their work, not a judgement. The DfE’s secondary accountability guidance (updated October 2025) says schools should not predict pupil-level progress scores, or share them with pupils and parents. See Do not predict or share pupil-level Progress 8.
Eng/Mat
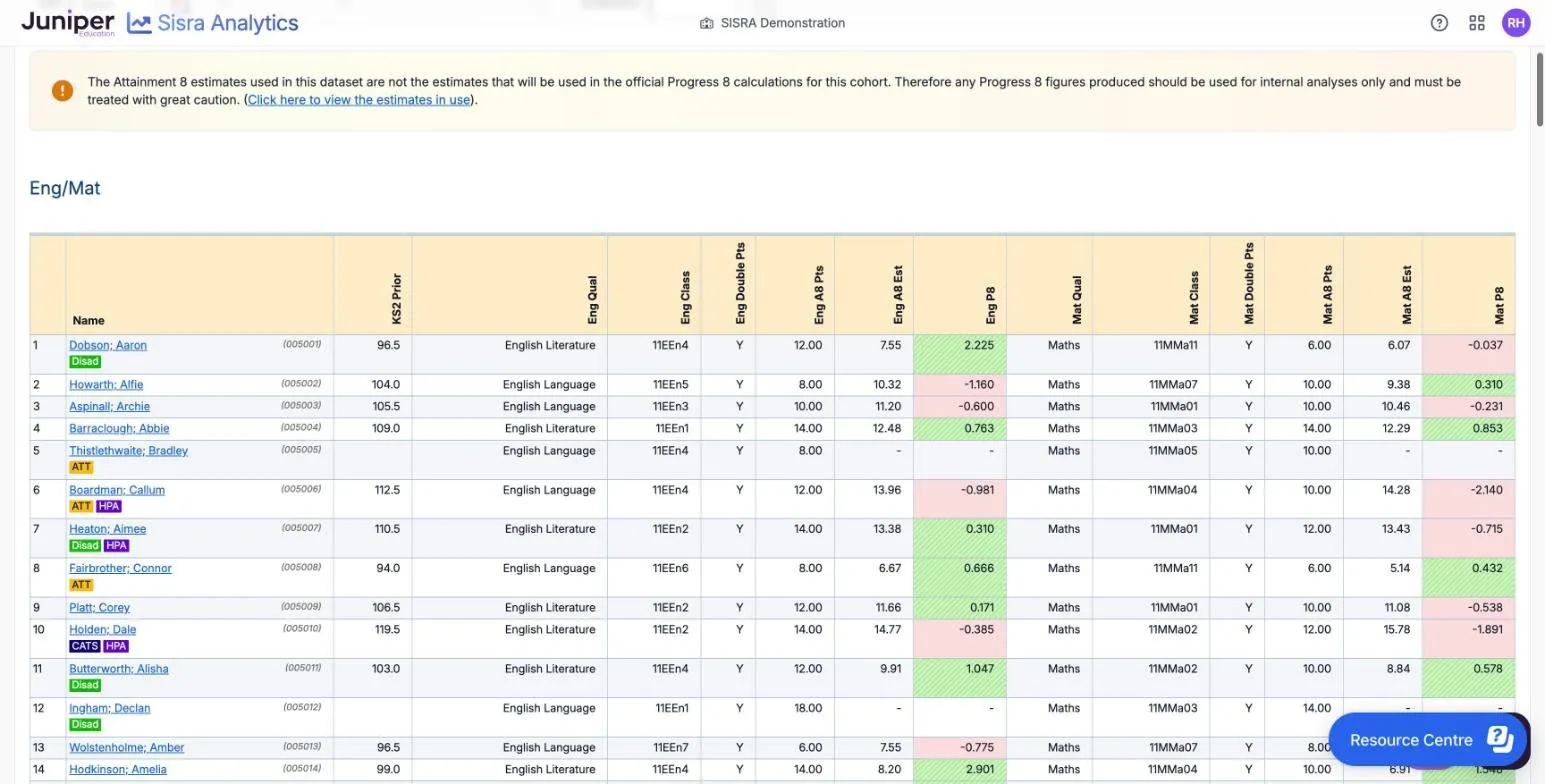
Section titled “Eng/Mat”Eng/Mat shows which qualification fills each pupil’s English and maths slots, and their Progress 8 in each.
Read the report
Section titled “Read the report”| Column | What it shows |
|---|---|
| Eng Qual, Mat Qual | The qualification in the slot, such as English Language or English Literature |
| Eng Class, Mat Class | The pupil’s class in that qualification |
| Eng Double Pts, Mat Double Pts | Y if the slot counts twice. English counts twice only if the pupil took both English language and English literature |
| Eng A8 Pts, Mat A8 Pts | The points in the slot |
| Eng A8 Est, Mat A8 Est | The estimate for the slot |
| Eng P8, Mat P8 | (points − estimate) ÷ 2 |
Dobson; Aaron’s English slot holds English Literature, his better English grade, in class 11EEn4. It counts twice, for 12.00 points against an estimate of 7.55, so his Eng P8 is (12.00 − 7.55) ÷ 2 = 2.225. His maths, in class 11MMa11, gives 6.00 points against an estimate shown as 6.07, so his Mat P8 is −0.037. The report rounds the estimate, which is why (6.00 − 6.07) ÷ 2 gives −0.035 instead. The summary row gives 10.70 English points against an estimate of 10.62, and 9.70 maths points against 9.95.
Points to watch
Section titled “Points to watch”A pupil who takes only one English qualification has N in Eng Double Pts. Their English slot counts once, which pulls down their English and overall Progress 8.
The EBacc report shows the points in each pupil’s three EBacc slots, against the estimate, and how many slots they filled.
Read the report
Section titled “Read the report”| Column | What it shows |
|---|---|
| Slot 1 Pts, Slot 2 Pts, Slot 3 Pts | The points in each EBacc slot |
| Total Pts | The three slots together |
| EBacc A8 Est | The estimate for the three slots |
| EBacc P8 | (Total Pts − EBacc A8 Est) ÷ 3 |
| Slots Filled | The EBacc slots filled, out of 3 |
| Slots Est | The average number of EBacc slots filled by pupils with the same KS2 score, from the estimates |
| Slots Diff | Slots Filled − Slots Est |
In the 25/26 leavers’ results, the summary row gives 15.10 EBacc points against an estimate of 14.72, and an EBacc P8 of 0.117. Pupils filled 2.80 EBacc slots on average, against 2.84 expected, so Slots Diff is −0.04.
Points to watch
Section titled “Points to watch”A negative Slots Diff means pupils filled fewer EBacc slots than the estimates expect for their KS2 scores. That comes from which subjects they took. A negative EBacc P8 with a Slots Diff near 0 points to the grades instead.
The Open report does the same for the three open slots, and splits their points between GCSEs and other qualifications.
Read the report
Section titled “Read the report”The columns are those of the EBacc report, with Tot Pts for the total and two more:
| Column | What it shows |
|---|---|
| GCSE Tot Pts | Open points from GCSEs and AS levels |
| Non-GCSE Tot Pts | Open points from other qualifications, such as BTECs and Cambridge Nationals |
In the 25/26 leavers’ results, the open slots average 15.58 points: 15.26 from GCSEs and 0.32 from other qualifications. Against an estimate of 14.93, Open P8 is 0.214. Pupils filled 3.00 open slots on average, against 2.86 expected.
The Filters level
Section titled “The Filters level”At Filters level, each row is one value of a filter, such as Disadvantaged. Each figure is the average for the pupils with that value. Stu Count gives how many there are. Filters with more than 15 values are left out. Give the number of pupils with every average you quote: see Take care with small groups.