


 Sonar Tracker
KS3/4 reports
Tracker reports
The tracker sets up to six of a cohort’s published data sets or assessment collections side by side. Most figures are coloured by whether they rose or fell since the column before. Use it to see how a cohort, a qualification or a pupil has moved from one data collection to the next.
Where to find it: on the reports home, select the cohort’s Tracker folder, then Whole Cohort, Qualifications or Students. Inside a report, select Track on the Dataset tab, or T beside a data set in the Main Focus list. View goes back to one data set.
Who can see it: anyone who can open the same reports for a single data set. The tracker has its own status. If the tracker, or any data set in it, is Locked, it opens only for authority groups with View Locked Reports.
An administrator builds the tracker from data sets already published, in slots 1 to 6, earliest first: see Generate the tracker. The examples use the demo school’s 26/27 cohort, this year’s year 11. Its tracker holds three year 10 collections of predicted grades: Y10 Autumn, Y10 Spring and Y10 Summer.
Options
Section titled “Options”| Option | What it does | Default |
|---|---|---|
| Track: | Chooses the figure each column shows. The choices depend on the report | The first choice |
| Sub : | Whether sub-grades count when grades are compared with expected grades | Sub |
| Filters, Options and Measures tabs | Narrow the pupils, as in any report | None |
| Sort : | Sorts the rows by any column, including each data set’s column | Name |
| Report | Track: choices |
|---|---|
| Headlines Summary | Total |
| Grades Overview | Average Points |
| Grades Totals at Students level | Average Points and Avg EAP Diff |
In Track, Project and Compare are switched off and the DATA COLLAB bar is hidden. Count : and Standard : show N/A. Report tools and options describes the other controls.
Read the tracker
Section titled “Read the tracker”Each data set has a column, headed with its name and the figure, such as Y10 Autumn Total or Y10 Spring Avg Pts. The heading of the data set you opened, the main focus, is salmon pink. Each column after the first is coloured against the column before it:
| Colour | Meaning |
|---|---|
| 40.30 ↗ light green, rising arrow | Higher than in the column before |
| 39.38 ↘ pink, falling arrow | Lower than in the column before |
| No colour | The same as in the column before, the first column, or a figure the tracker does not compare, such as a confidence limit |
The Headlines tracker
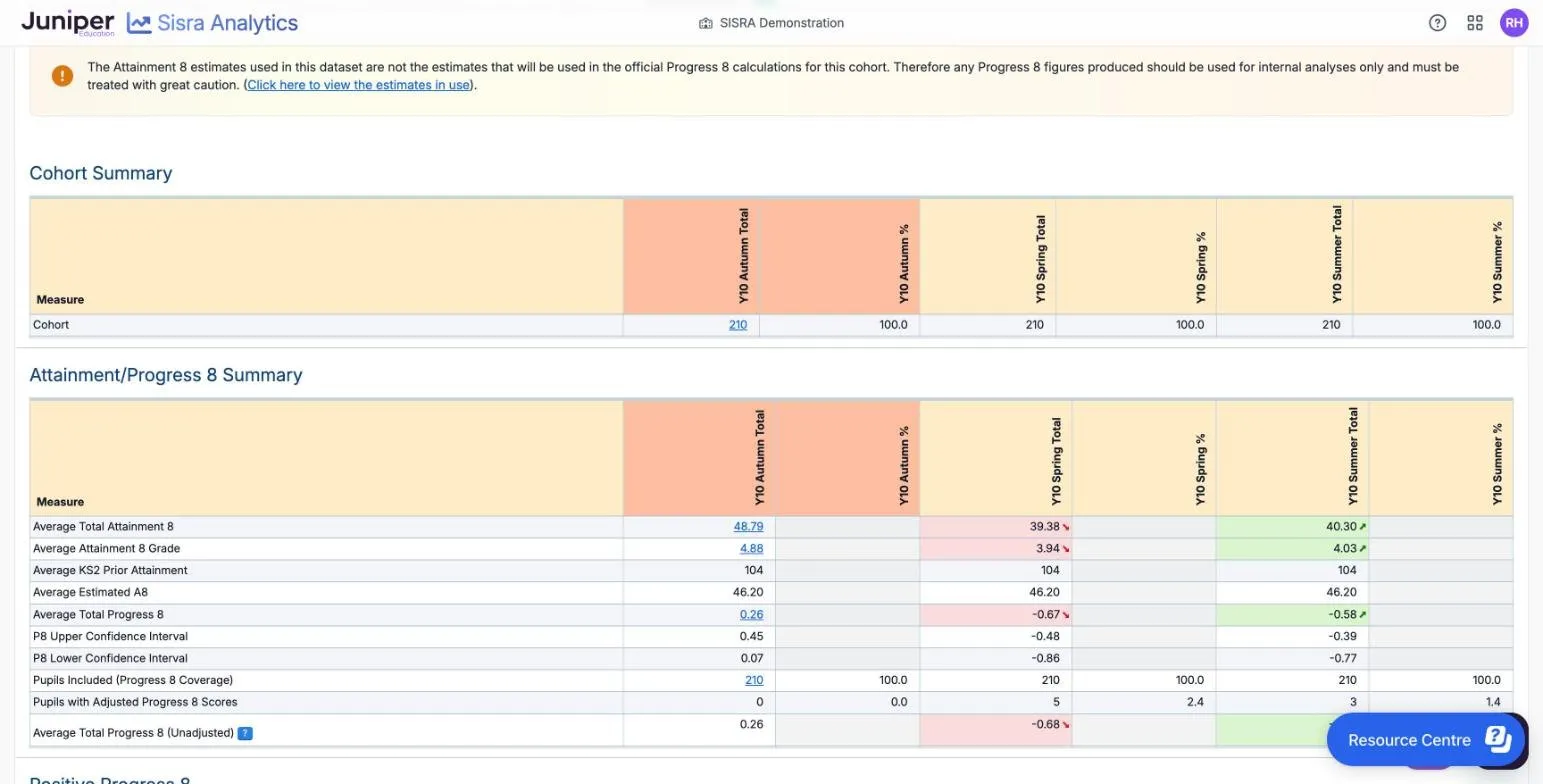
Section titled “The Headlines tracker”In the 26/27 cohort’s year 10 predictions:
| Measure | Y10 Autumn Total | Y10 Spring Total | Y10 Summer Total |
|---|---|---|---|
| Average Total Attainment 8 | 48.79 | 39.38, pink | 40.30, light green |
| Average Total Progress 8 | 0.26 | −0.67, pink | −0.58, light green |
| Average Estimated A8 | 46.20 | 46.20 | 46.20 |
| Pupils with Adjusted Progress 8 Scores | 0 | 5 (2.4%) | 3 (1.4%) |
The fall came between autumn and spring, with a small rise in summer. The average estimate is the same in every column, because the pupils and estimates are the same. So Progress 8 moves with Attainment 8. In spring, (39.38 − 46.20) ÷ 10 = −0.68: the 5 adjusted scores lift the average to −0.67.
The Grades trackers
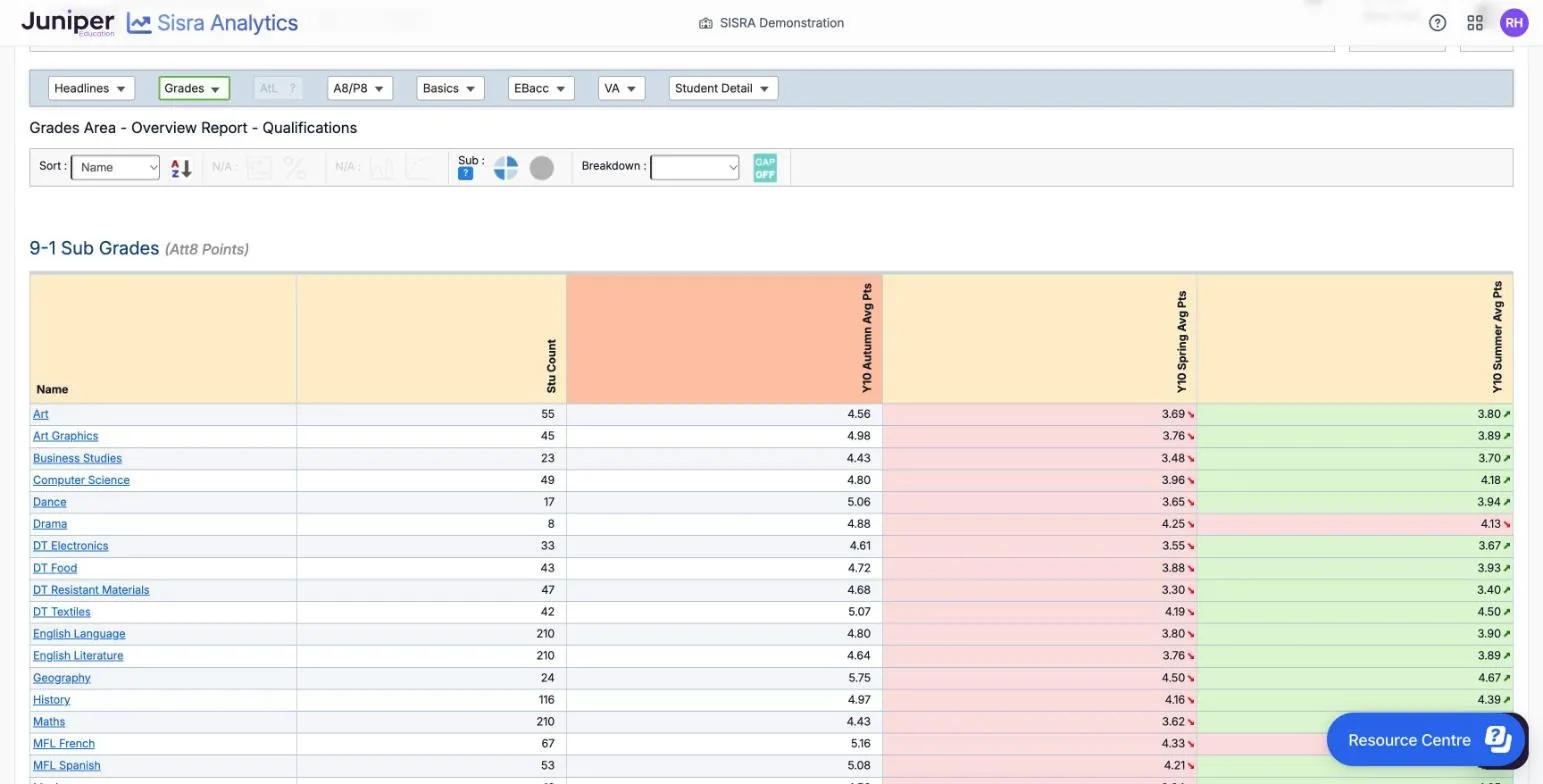
Section titled “The Grades trackers”At Qualifications level, the Grades Overview tracker gives each qualification’s average points in each collection, with Stu Count. In the 26/27 cohort, art (55 pupils) goes from 4.56 to 3.69, then 3.80. Drama (8 pupils) falls twice, from 4.88 to 4.25, then 4.13.
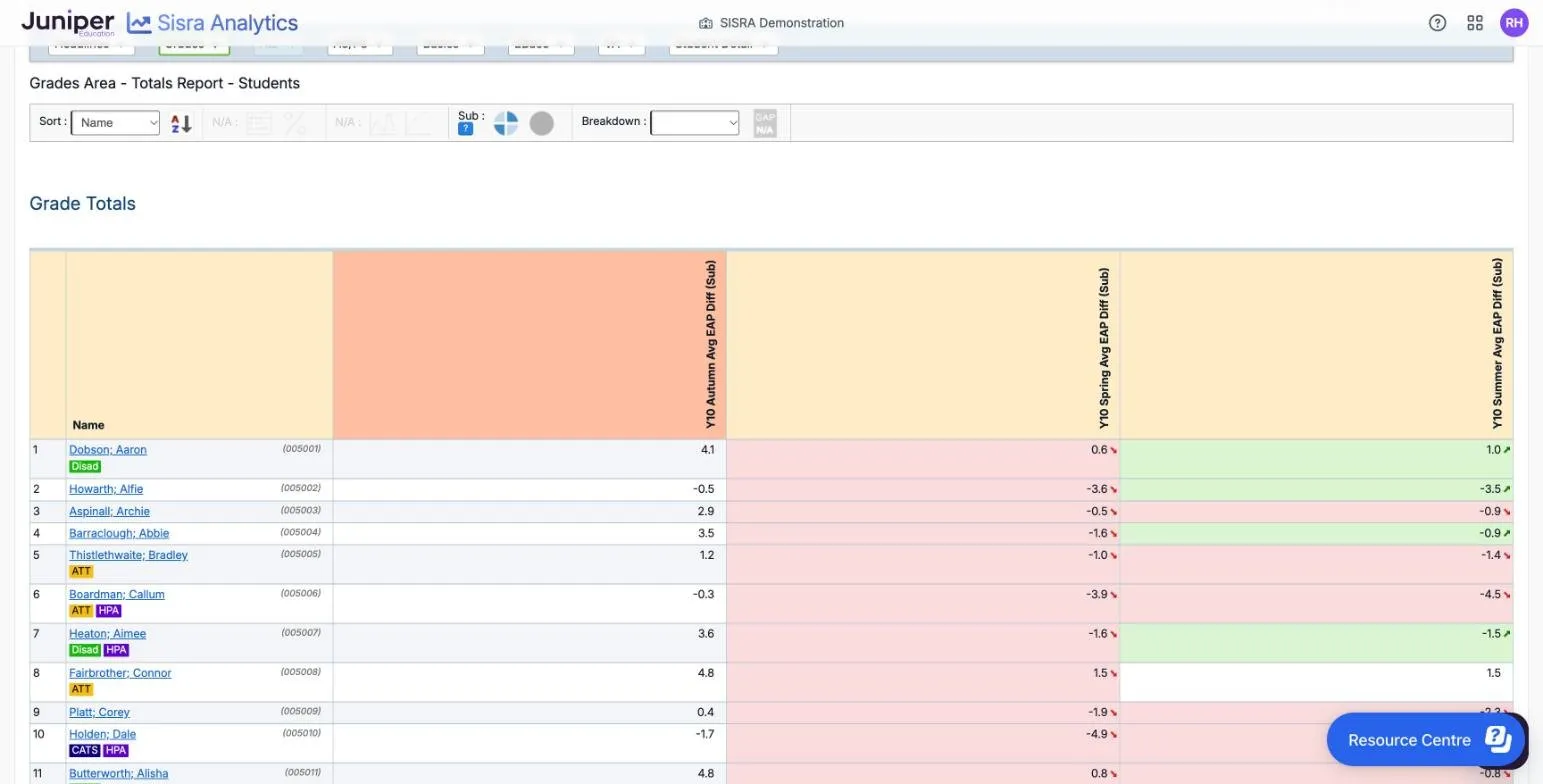
At Students level, the Totals tracker with Avg EAP Diff shows how far each pupil’s grades are from their expected grades, on average, in sub-grades. Dobson; Aaron goes from 4.1 to 0.6, then 1.0. Fairbrother; Connor goes from 4.8 to 1.5, and stays at 1.5, so his summer figure has no colour.
A KS3 tracker
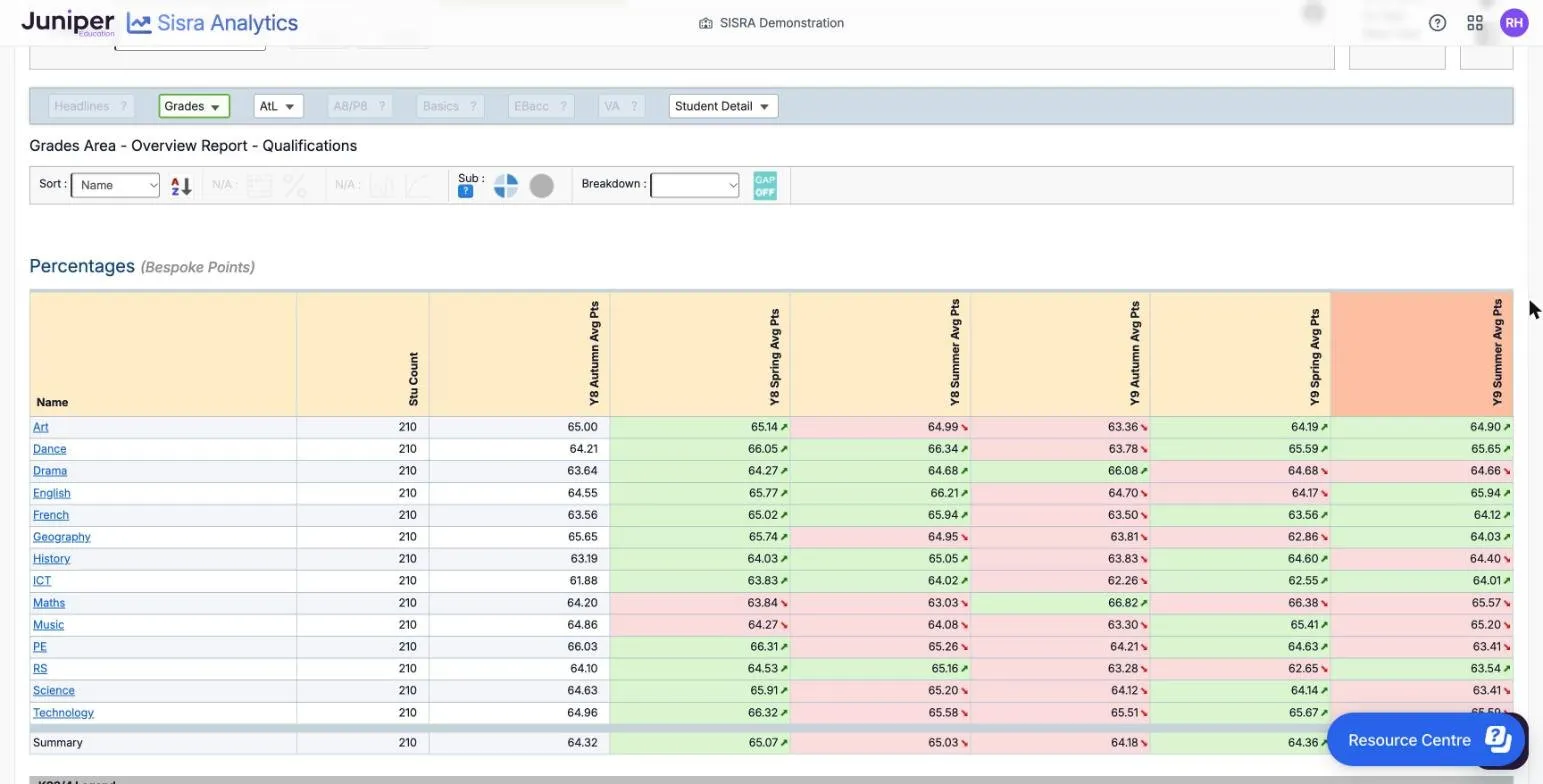
Section titled “A KS3 tracker”A tracker can hold KS3 collections. The demo school’s 27/28 cohort, now in year 10, has a tracker of six KS3 collections, from Y8 Autumn to Y9 Summer. They are graded in percentages with the school’s own points, so the headline areas are greyed out. On the reports home, this tracker offers only the Grades buttons.
Points to watch
Section titled “Points to watch”The colours show only the direction of a change, not its size. In the 27/28 tracker, drama’s fall from 64.68 to 64.66 is as pink as a fall of several points.
Each column shows whatever its data set holds. Compare collections of the same kind of grade, such as working-at grades with working-at grades. A tracker that runs from working-at grades to predictions, or from predictions to targets, shows a change of kind, not progress. Data sets, assessment collections and grade types explains the difference.
Each column’s headline figures use the DfE rules and estimates its data set was published with. If these differ between collections, so can the Progress 8 figures, whatever the pupils did.
Small groups swing. Drama’s 8 pupils make each of its averages unstable: see Take care with small groups.
Sub and Whole change the tracker’s comparisons with expected grades. With Sub, a 5- against an expected 5+ counts as below.