


 Sonar Tracker
Getting started
Get started as a head of department or teacher
This tutorial shows heads of department and teachers how to get to their subject and classes in Sisra Analytics, and how to read what they find there. Work through it with Sisra open, after your school publishes a data collection. The first half covers years 7 to 11 (KS3/4), and the second the sixth form (KS5).
The examples come from Juniper Education’s demo school. Its 26/27 cohort is this year’s year 11, and its 25/26 cohort left year 11 in summer 2026.
Before you start
Section titled “Before you start”You need:
- a Sisra account, which you sign in to through Juniper Portal with your work email address (see Sign in and switch schools)
- an authority group with View Qualification Report and View Student Report. At KS5, the Value Added report and a student’s Headlines Summary also need View Headline Report. The User group has all three
- to know what each collection holds, such as working-at or predicted grades, and what your school’s expected grades are based on
Sisra does not limit staff to their own classes or subjects. Anyone who can open the qualification or student level can open it for every class in the cohort. So treat colleagues’ classes with the same care as your own.
Go straight to your subject or class
Section titled “Go straight to your subject or class”- Select REPORTS, then the KS 3/4 tab, then the cohort’s tab, such as 26/27 (Yr 11).
- Select the folder, such as Year 10 Data, then the arrow beside the collection, such as Y10 Summer.
- Select Take me to a qualification/class.
- Choose the Qualification, such as Maths, and a Class. Leave Class blank for the whole qualification.
- Select Go!.

The Grade List opens for that class. Sisra remembers your choice for the cohort, so next time the same qualification and class are ready. There are no My Classes links at KS3/4. To come back to a view after you look at other reports, select Pin This Report first, then Return to Pin.
For the whole department, select Take me to the reports, then Qualifications under Grades. The Grades Overview usually opens, with a row for each qualification. Select a qualification’s name to see its classes, and a class to see its Grade List.
Read your subject’s figures
Section titled “Read your subject’s figures”The Grades Overview at Qualifications level sets every subject side by side, one row each.
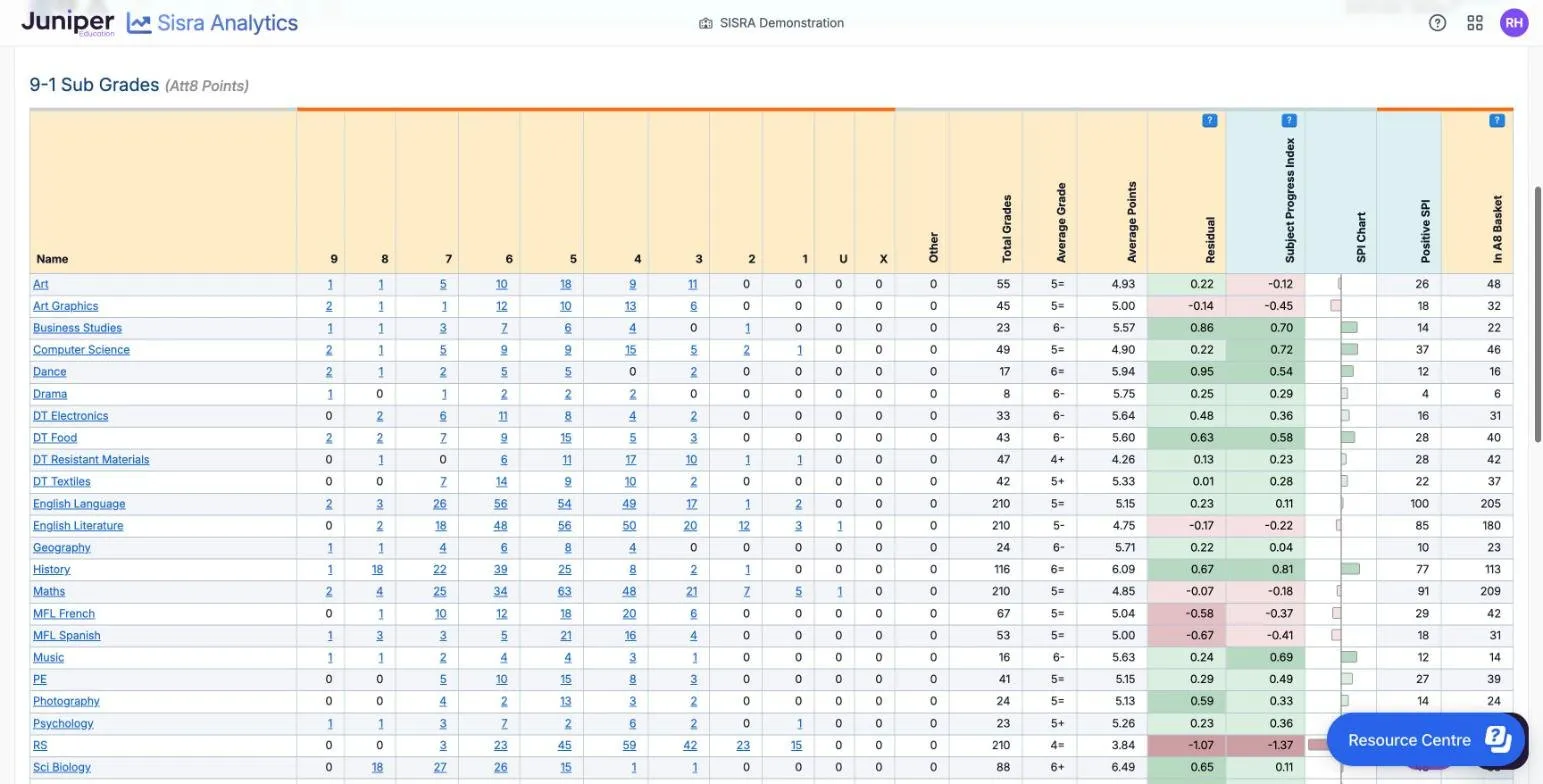
Each row gives the number of each grade, the average grade and the average points. Two columns compare your subject with something else:
| Column | Compares your pupils’ grades with | Shading |
|---|---|---|
| Residual | The same pupils’ grades in their other subjects, in your school | Green above 0, red below, darker further from 0 |
| Subject Progress Index (SPI) | The average grade of pupils with the same KS2 score who took the subject in Sisra Data Collaboration | The same |
In the demo school’s 2026 results, history’s 116 grades average 6.09 points. Its residual of 0.67 means its pupils did about two-thirds of a grade better in history than in their other subjects. Its SPI of 0.81 puts them about four-fifths of a grade above pupils with the same KS2 scores who took history in the 2026 collaboration.
Read both with care. Residuals always balance out, so if one subject is above 0 another must be below. They also reflect how severely each subject is graded. Both languages in the demo school have negative residuals, which fits research showing that languages are graded more severely than English and maths. See Read residuals and subject differences with care.
SPI needs a KS2 score for each pupil. For the 24/25 and 25/26 cohorts, who took no KS2 tests, it is blank unless your school uploaded converted scores. The demo school has such scores, so its 25/26 SPI rests on converted scores, as does the 2026 collaboration it is compared with. Subject Progress Index explains where the averages come from.
Read grades against expected grades
Section titled “Read grades against expected grades”The Grade List shows each pupil’s grade beside their expected grade for the term. Expected grades come from your school’s Expected Attainment Pathways (EAPs). An EAP sets out the grade a pupil is expected to reach each term from a starting point, such as their KS2 score or a target. Your school may use its own word for “EAP” in the headings.
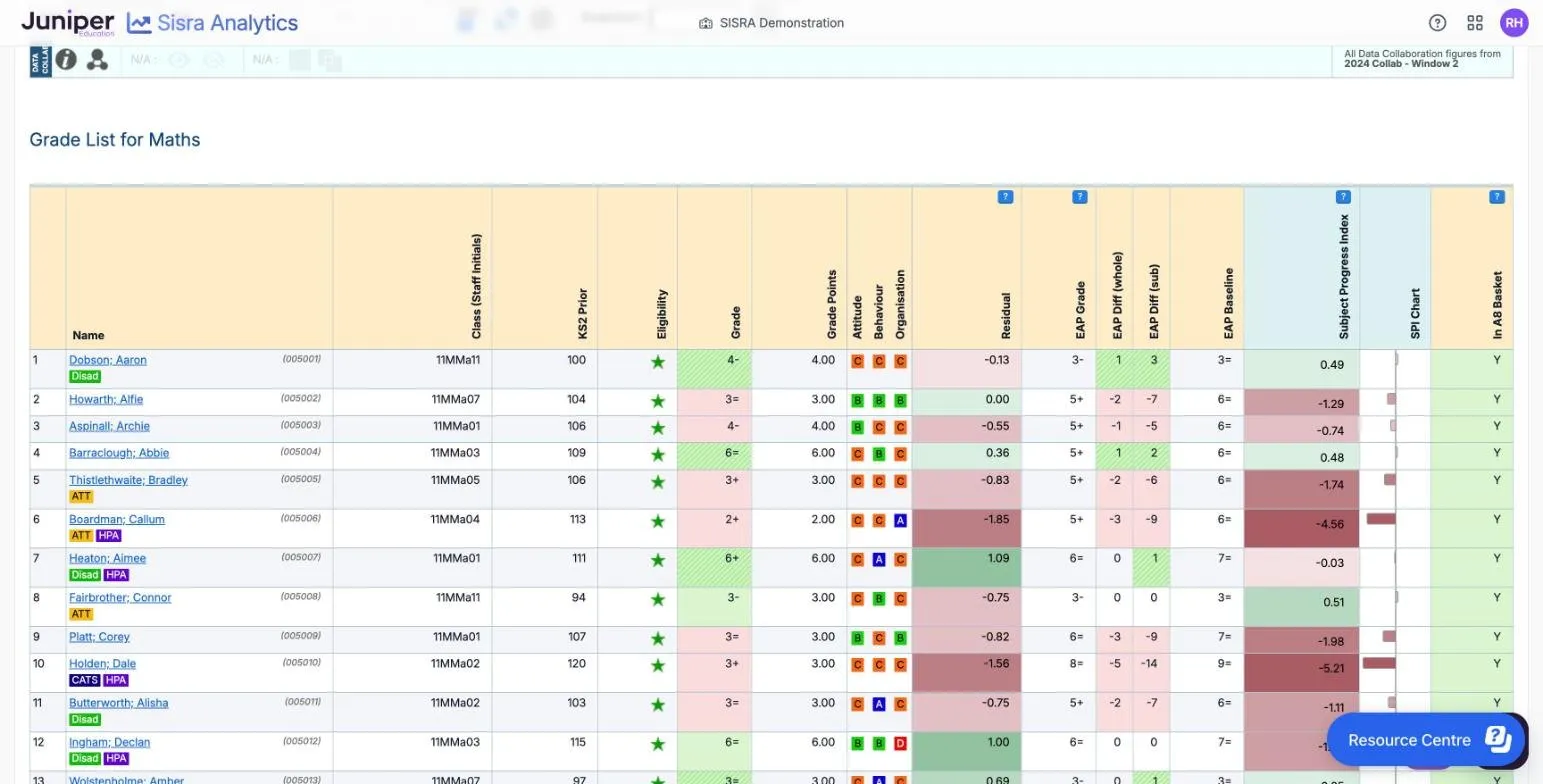
| Colour of Grade | Meaning |
|---|---|
| 4- green, striped | Above the EAP grade |
| 3- light green | On the EAP grade |
| 3= pink | Below the EAP grade |
In the demo school’s Y10 Summer maths predictions, Dobson; Aaron has 4- against an EAP grade of 3-. EAP Diff (whole) shows 1 whole grade above, and EAP Diff (sub) 3 sub-grades above. Howarth; Alfie has 3= against 5+, so 2 whole grades and 7 sub-grades below. The Residual and Subject Progress Index columns give each pupil’s figures. The Attitude, Behaviour and Organisation columns give their Attitude to Learning (AtL) judgements.
Sub : on the toolbar decides whether sub-grades count. With Sub, a 6+ against an EAP grade of 6= is above track. With Whole, it is on track. To list only the pupils below their expected grade, select Below Track in the On Track panel. In the demo school’s maths predictions, that leaves 155 of the 210 pupils.
When most of a class is below track, check what the expected grades are based on before you act. Working-at grades set against a pathway of end-of-course targets put most pupils below track early in a course. EAPs, flight paths and on track explains how expected grades are made.
Compare with targets
Section titled “Compare with targets”- In the Grade List, select the Dataset tab.
- Open the Compare list and select V next to the targets data set, such as KS4 Targets.
Each pupil gets a second row, such as KS4 Targets >, with their target grade. Their grade is light green with an up arrow when it is higher than the target, and pink with a down arrow when it is lower. Grade Points (Diff) gives the difference in points. Dobson; Aaron’s 4- is 1.00 point above his target of 3, and Howarth; Alfie’s 3= is 3.00 points below his target of 6.
With Compare on, the Comparison Matrix on the Grades menu counts pupils by both grades. In the demo school’s 2026 maths results against targets, 66 pupils got their target grade, 36 did better and 108 did worse. See Comparison Matrix.
Look at one pupil
Section titled “Look at one pupil”Select a pupil’s name in any report to open their Student Detail Overview. It lists every grade the pupil has in the data set, with its class, residual, SPI, expected grade and differences. A red down arrow under Eligibility marks a grade that is discounted from the headline measures.
In the demo school’s 2026 results, Barraclough; Abbie got a 9 in art against an EAP grade of 6: 3 whole grades and 9 sub-grades above. Her art residual is 2.45, because her average across 11 grades is 6.55 points. If your school has generated flight paths for the data set, a chart shows the pupil’s grades against their pathway, one qualification at a time. Student Detail reports explains each section.
At KS5, save your classes in My Classes
Section titled “At KS5, save your classes in My Classes”At KS5, you can save links to up to five classes in each cohort. Your links are yours alone.
- Select REPORTS, then the KS5 tab, and choose the cohort under CURRENT COHORTS, such as 26/27 (Yr 13).
- In DATA SET, choose the data set or collection, such as Assessments - Y12 Spring.
- Under MY CLASSES, select Add Classes.
- Choose the Qualification, then the Class. Leave Class blank for every student in the qualification.
- Select Add.
Select a saved link to open the Grade List for that class. A link shows whichever data set is chosen in DATA SET, and is marked as not available if the class has no grades in it.
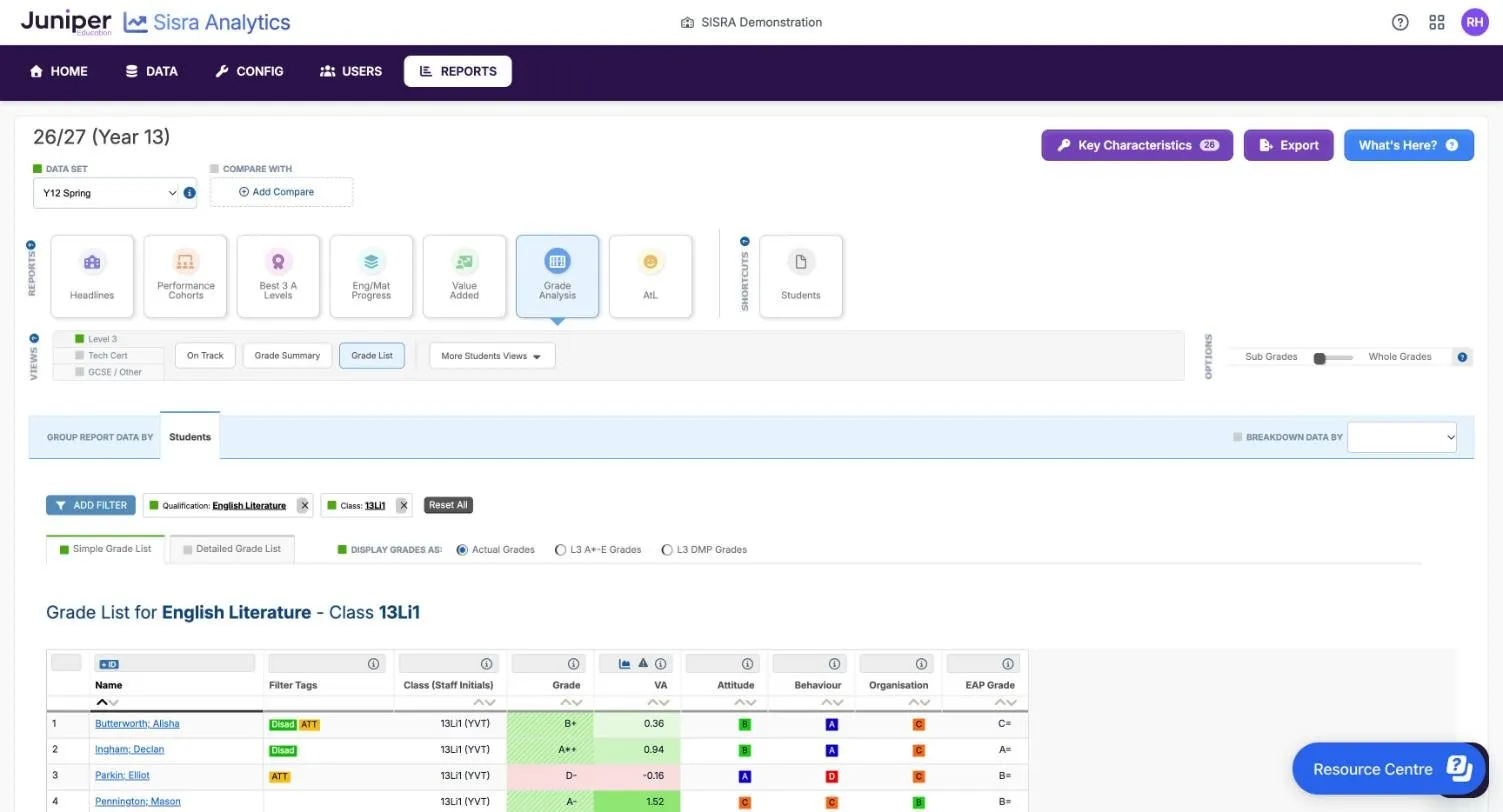
The link opens the Simple Grade List tab. Grade is coloured against the EAP grade as at KS3/4: green and striped above, light green on, pink below. VA is the student’s value added in the qualification: how their grade compares with students nationally with similar KS4 results. A VA of +1.00 is one grade above expectation in an A level. The Detailed Grade List tab adds points, KS4 prior attainment, the VA expectation, the residual and the EAP differences.
For the demo school’s English literature class 13Li1, the 26 students’ average VA is 0.19 on the Y12 Spring predictions. For a current cohort, VA uses an earlier year’s national data, so treat it as an internal estimate. See How Sisra calculates the KS5 measures.
See your subject and its classes
Section titled “See your subject and its classes”- Select Grade Analysis, under STANDARD REPORTS on the reports home or REPORTS on a report page.
- In GROUP REPORT DATA BY, select Classes.
- In the Filters panel that opens, choose your Level 3 Qualification, then select Apply.
Each class gets a row with its grades, average grade, VA, residual and track figures. In the demo school’s maths predictions, 13Ma3 has a VA of 0.99 across 28 grades, and 13Ma1 0.37 across 24. A class of 24 grades has wide confidence limits, which the Value Added report shows at Classes.
COMPARE WITH adds a targets data set, as Compare does at KS3/4. Selecting a student’s name opens a panel with their Detailed Overview and Headlines Summary, and Next Student > moves through the class. See Grade Analysis and AtL reports and Student reports.
Look at your subject over several years
Section titled “Look at your subject over several years”Select REPORTS, then on the KS 3/4 or KS5 tab select VIEW THE QUALIFICATION TRENDS REPORT. Choose your subject in Qualification:. The report sets each year’s exam results for that subject side by side. In the demo school, maths average points were 4.81, 4.81, 4.73, 4.73 and 4.85 from 21/22 to 25/26. Trends work only for qualifications with the same name in every cohort. See Headline Trends and Qualification Trends.