


 Sonar Tracker
KS3/4 reports
Grades reports
The Grades area shows the grades themselves: how many of each grade a qualification, class or pupil has. It also compares them with expected grades, other data sets and similar pupils in other schools. It has seven reports. Two of them, Transition Matrix and SPI Scattergraph, need Sisra Data Collaboration.
Where to find it: select Grades on the area bar, or Qualifications or Students on the reports home. Take me to a qualification/class opens the Grade List. See Open the KS3/4 reports.
Who can see it: authority groups with View Qualification Report see the Filters, Faculties, Qualifications and Classes levels. View Student Report opens the Students level. Both are in Admin and User by default.
The Grades area uses each pupil’s best grade in each qualification, not the first entry that the headline measures use. It includes guests, and grades that the DfE’s rules would discount. It works for any data set, including KS3 collections, and needs no headlines. The expected grade columns appear only where your school has entered expected grades in its Expected Attainment Pathways (EAPs).
The examples use the demo school’s 26/27 cohort, this year’s year 11, and its Y10 Summer collection of predicted grades. Most screenshots show the 25/26 leavers’ Exams. For 25/26, figures that depend on KS2 scores, such as KS2 Prior and the Subject Progress Index (SPI), use the demo school’s unofficial KS2 scores.
Options for every Grades report
Section titled “Options for every Grades report”These options work across the Grades area. Report tools and options describes each one.
| Option | What it does | Default |
|---|---|---|
| Grade Type | Shows one grade method. In the Overview and Totals, All A8 Quals puts every qualification with Attainment 8 points on one 9 to 1 scale | None: one table for each grade method |
| Faculty, Qualification, Class | Narrow the report to a faculty, qualification or class. A qualification locks Grade Type | None |
| On Track | Shows only grades above, on or below the expected grade | All |
| Residual Excl. tab | Leaves qualifications out of residuals | Every qualification included |
| AtL tab | Shows only grades with chosen Attitude to Learning (AtL) judgements | None |
| Count : or Percentage : | Counts or percentages | Count |
| Standard : or Cumulative : | Single grades or grade ranges, such as 9 - 5 | Standard |
| Sub : | Whether sub-grades count when grades are compared with expected grades or another data set | Sub |
Overview
Section titled “Overview”The Overview counts the grades in each qualification, grade by grade, with averages, residuals and the SPI. It works at Filters, Faculties, Qualifications, Classes and Students level. At Filters and Students level, choose a Grade Type on Options. At Classes level, choose a Qualification.
Read the report
Section titled “Read the report”Each grade method has its own table, such as 9-1 Sub Grades (Att8 Points) or BTEC Tech Sub Grades (Att8 Points). Each ends with a Summary row for everyone in the table.
| Column | What it shows |
|---|---|
| Grade columns, such as 9 to 1, U, X and Other | The number of grades of each kind. A BTEC table has D*, D, M, P and the level 1 grades |
| Total Grades | All the grades in the row |
| Average Grade | The average grade, with its sub-grade, such as 5= |
| Average Points | Total points ÷ total entries |
| Residual | The average of the pupils’ residuals: how the grades compare with the same pupils’ grades in their other qualifications |
| Subject Progress Index | The average of the pupils’ SPIs: how the grades compare with those of similar pupils in the Data Collaboration |
| SPI Chart | A bar for the SPI, to the right of 0 in green or to the left in red |
| Positive SPI | The number of grades with an SPI of 0 or more. A combined science grade counts as two |
| In A8 Basket | The number of grades that are, or could be, in an Attainment 8 slot |
Residual and Subject Progress Index cells are shaded green above 0 and red below, darker the further from 0. Blue, underlined counts are links to the pupils. Residuals and Subject Progress Index explain both measures.
In the 26/27 cohort’s Y10 Summer predictions, maths has 210 grades, with an average grade of 4- and average points of 3.67. Its residual is −0.24, so pupils’ maths predictions are about a quarter of a grade below their predictions in their other subjects. Its SPI is −0.92, almost a grade below the average for pupils with the same KS2 scores in the 2024 collaboration. Those averages come from exam results, and these are year 10 predictions.
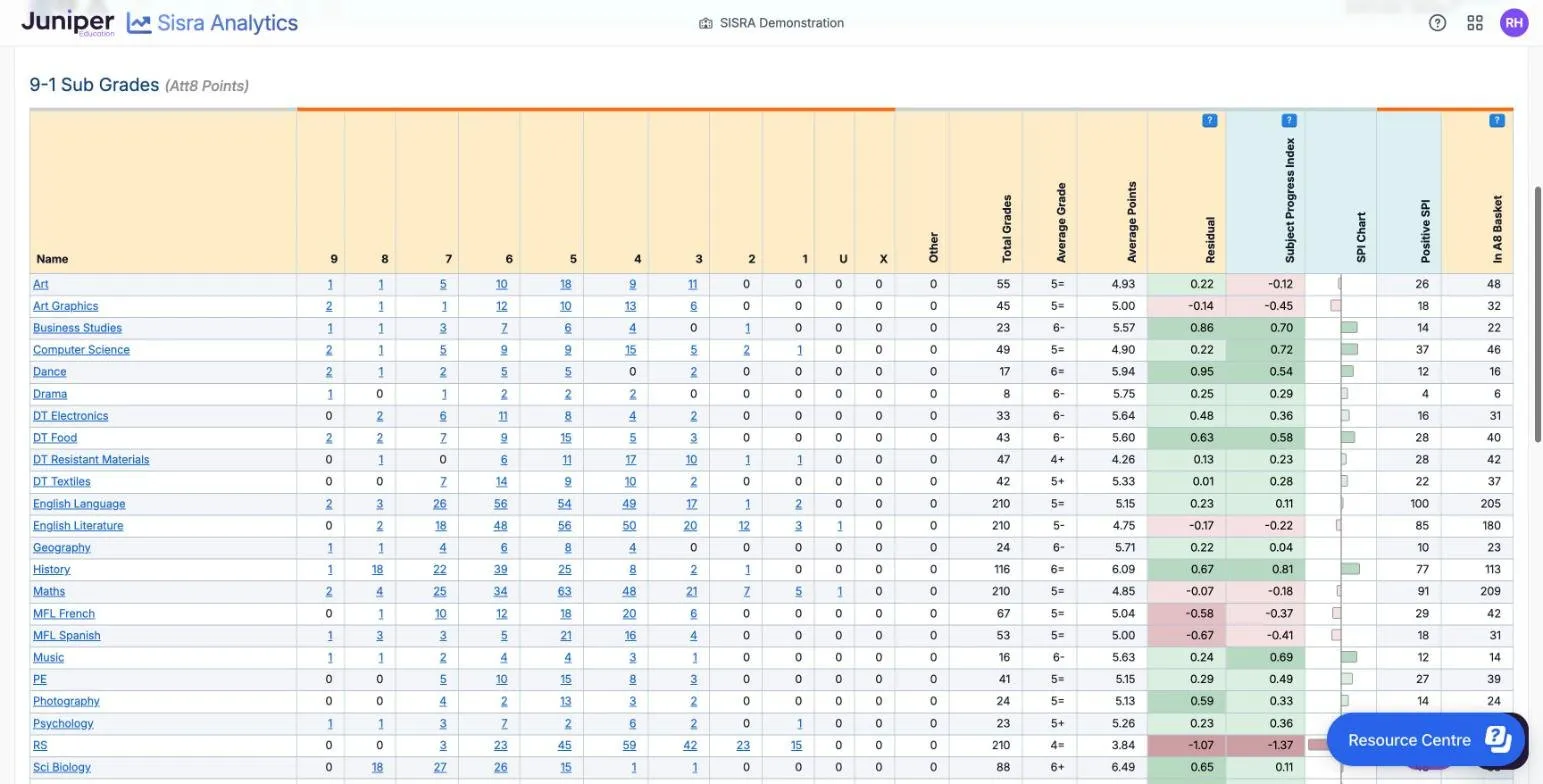
In the 25/26 leavers’ results, history’s 116 grades average 6.09 points, with a residual of 0.67 and an SPI of 0.81. Religious studies has 210 grades averaging 3.84 points, a residual of −1.07 and an SPI of −1.37.
Grade ranges
Section titled “Grade ranges”With Cumulative and Percentage, the grade columns become ranges from the top grade down, such as 9 - 5 %. In the 25/26 results, 128 of the 210 maths grades (61.0%) are 5 or above, and 176 (83.8%) are 4 or above.
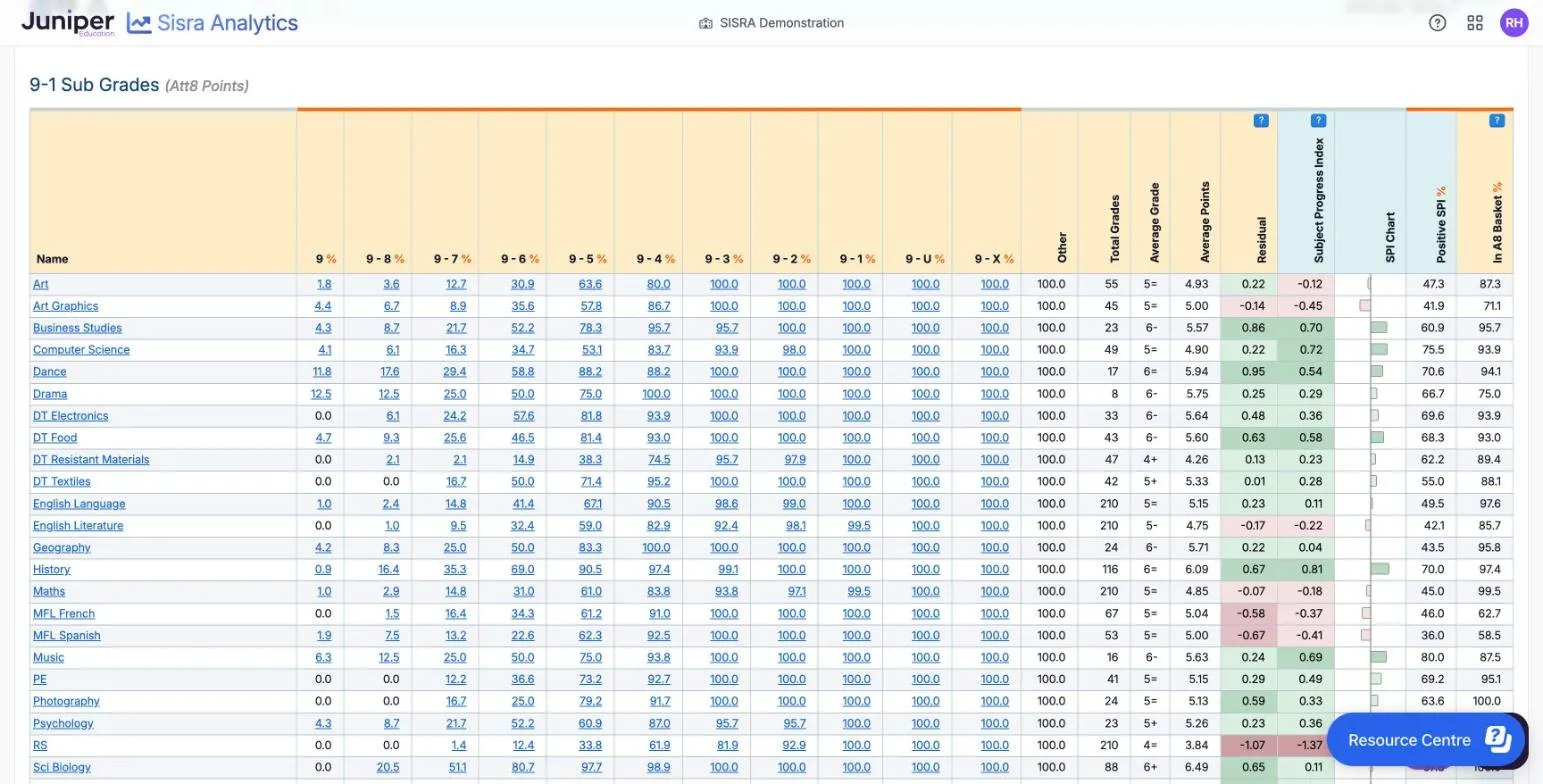
To count grade ranges across different kinds of qualification, choose All A8 Quals in Grade Type. Each grade is then placed on the 9 to 1 scale by its points. The choice appears only when the data set uses more than one grade method with Attainment 8 points.
Points to watch
Section titled “Points to watch”Percentages here are of grades, not pupils. The Headlines reports divide by the pupils in the cohort. So their figures can differ when, for example, some pupils have no grade in a subject.
Combined science counts as two grades. In the 25/26 results, 122 pupils took it, giving 244 grades.
Average Grade is blank where a row mixes grade methods, such as a pupil with GCSE grades and combined science. Use Average Points, or choose one Grade Type.
When a pupil has two grades worth the same points and one Attainment 8 slot is left, both count in In A8 Basket. Only one of them counts in the pupil’s Attainment 8, and which one makes no difference to the score.
A residual compares subjects within your school, not your school with others. A class residual says nothing on its own about teaching: see Read residuals and subject differences with care.
Totals
Section titled “Totals”Totals adds up the grades and points in each row, with averages, AtL and the track figures. It works at the same five levels as the Overview. At Students level, each row is one pupil across all their qualifications. At Classes level, choose a Qualification.
Read the report
Section titled “Read the report”| Column | What it shows |
|---|---|
| Total Grades, Total Points | The number of grades and their points |
| Average Grade | The average grade, blank if the grades use different grade methods |
| Average Points | Total points ÷ total entries |
| AtL columns, such as Avg Attitude | The average judgement or points in each of your school’s AtL categories |
| Avg EAP Diff (Sub) | How far the grades are from their expected grades, on average, in sub-grades |
| On/Above Track, Above Track, On Track, Below Track | The number of grades on or above, above, on and below their expected grades |
| Inc In Track | The number of grades that have an expected grade, so count in the track columns |
| Subject Progress Index, SPI Chart, Positive SPI, In A8 Basket | As in the Overview |
Tags under pupils’ names, such as Disad and HPA, are your school’s tags for filter values. In the demo school, AtL judgements show as letters: A in blue, B in green, C in orange and D in red.
In the 25/26 leavers’ results, Dobson; Aaron has 9 grades worth 36.00 points, an average of 36.00 ÷ 9 = 4.00. One grade is above its expected grade, 4 are on and 4 below. So On/Above Track is 1 + 4 = 5, and Inc In Track is 9. His Avg EAP Diff (Sub) is −1.1: on average, his grades are about one sub-grade below expected. Average Grade is blank because his grades use more than one grade method.
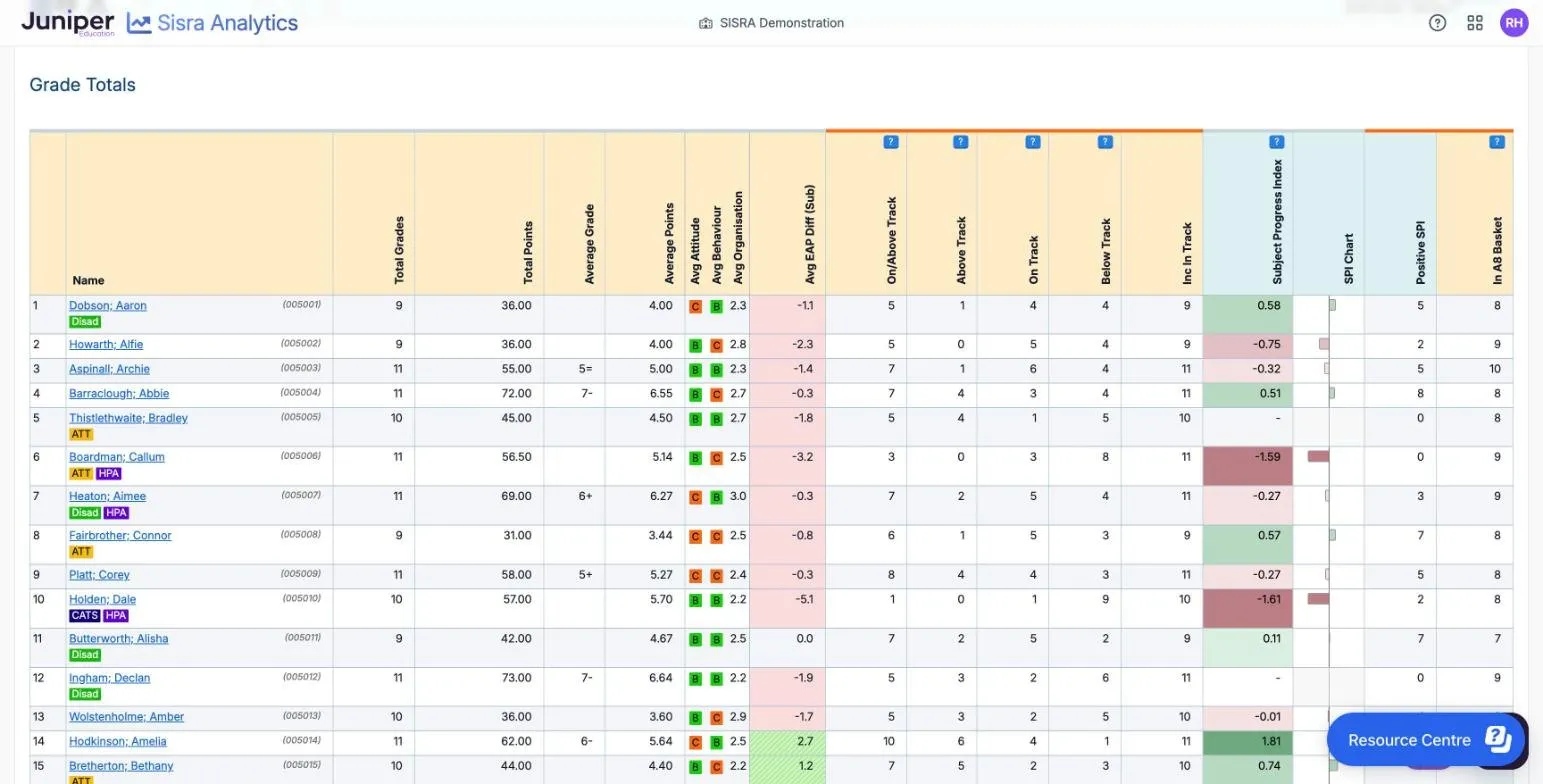
With Compare, each row gains a row for the second data set, such as KS4 Targets >, and a Difference > row. Totals also adds five columns. Four count grades on or above, above, equal to and below the second data set’s grade, such as >= KS4 Targets. N/A counts grades it cannot compare. If your EAPs expect each pupil’s target grade, the track columns and these columns give the same answer.
Points to watch
Section titled “Points to watch”The track columns use each pupil’s best grade and need expected grades. A pupil with no EAP baseline has none, so check Inc In Track against Total Grades. Sub and Whole change the track columns: see Sub and Whole.
Grade List
Section titled “Grade List”The Grade List shows each pupil’s grade in one qualification, with their expected grade, residual and SPI. It works at Students level only. Choose a Qualification on Options, and a Class if you want one. Until you do, it says “Please select a Qualification”.
Read the report
Section titled “Read the report”| Column | What it shows |
|---|---|
| Class (Staff Initials) | The pupil’s class in the qualification, and the teacher’s initials where your school has set them up |
| KS2 Prior | The pupil’s KS2 prior attainment |
| Eligibility | Whether the grade can count in the headline measures: see Legends and icons |
| Grade | The grade in this data set, coloured against the expected grade |
| Grade Points | Its points |
| Attitude, Behaviour, Organisation | The pupil’s AtL judgements, named after your school’s categories |
| Residual | The pupil’s points here minus their average points across all their qualifications |
| EAP Grade | The grade expected for this pupil, qualification and term, from their EAP |
| EAP Diff (whole), EAP Diff (sub) | How many whole grades, and how many sub-grades, the grade is above or below the EAP grade |
| EAP Baseline | The pupil’s starting point on the EAP, such as a target grade |
| Subject Progress Index, SPI Chart | The pupil’s SPI in the qualification |
| In A8 Basket | Y if the grade is, or could be, in an Attainment 8 slot |
Your school may have replaced “EAP” in these headings with its own word, such as Target.
| Colour of Grade | Meaning |
|---|---|
| 4- green, striped | Above the EAP grade |
| 3- light green | On the EAP grade |
| 3= pink | Below the EAP grade |
EAP Diff cells are green and striped above 0 and pink below. These colours appear only for a single data set at Students level, without Compare or Track. Your administrator can turn them off: see Colour coding.
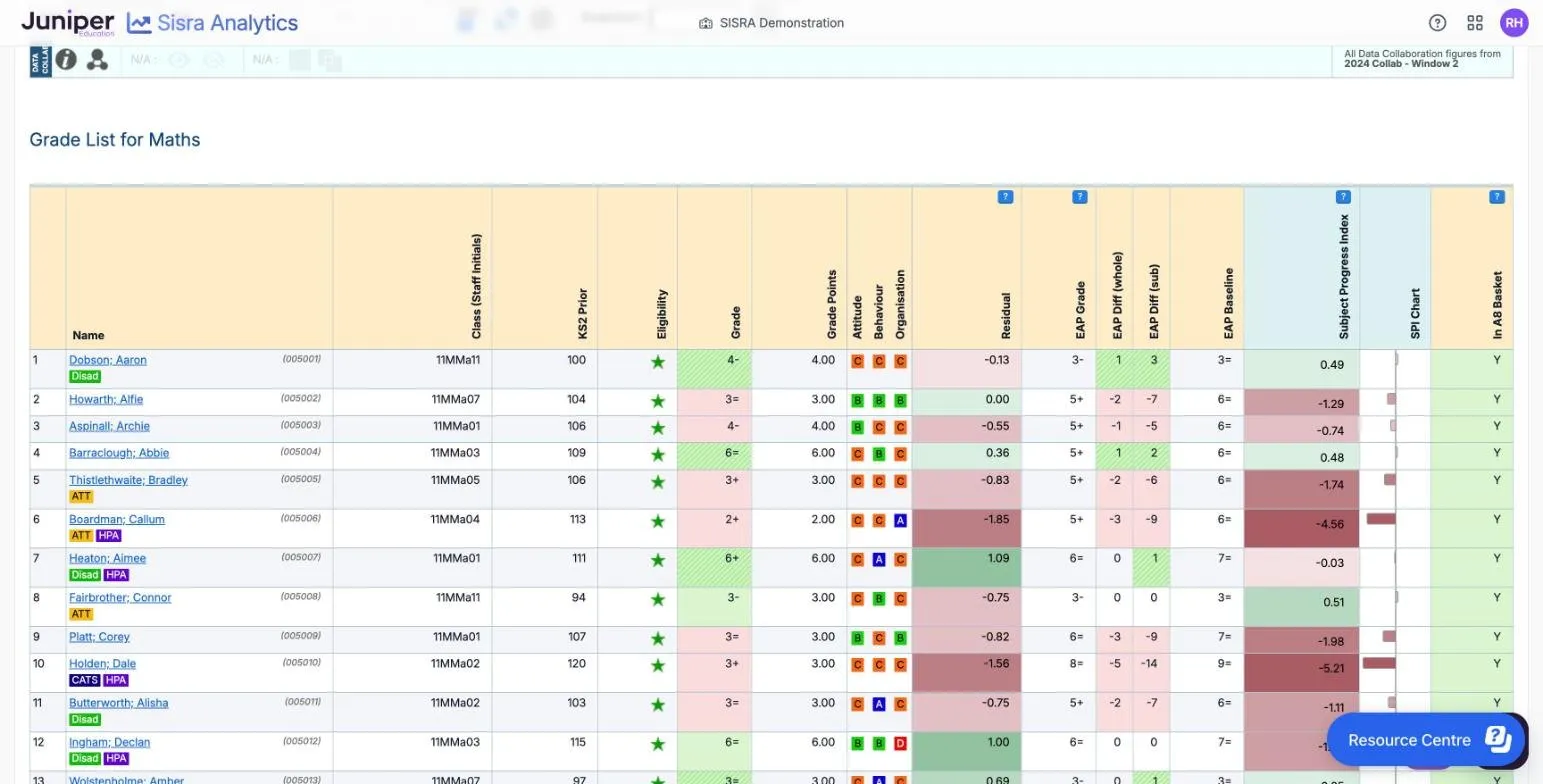
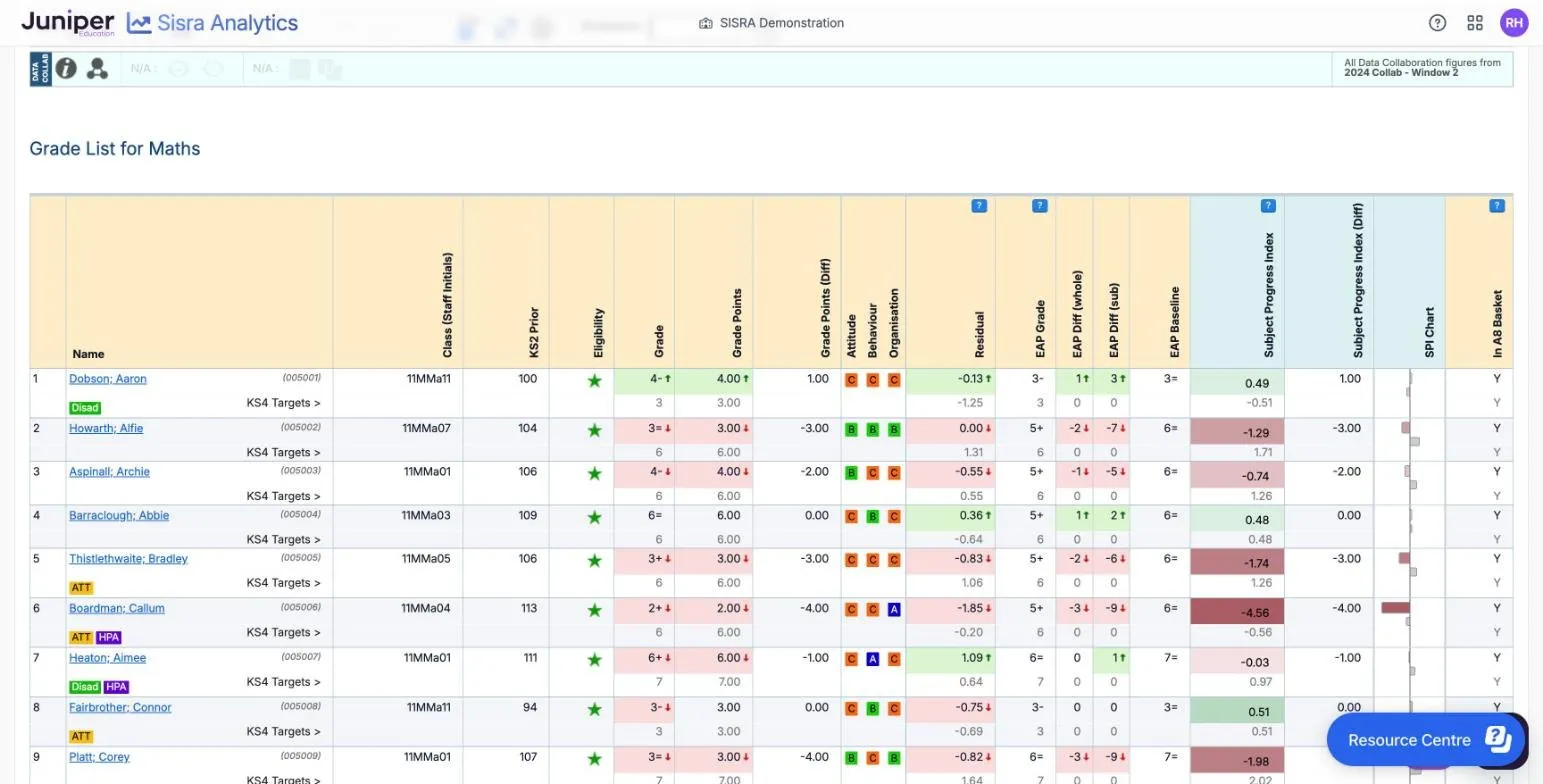
In the 26/27 cohort’s Y10 Summer maths predictions:
- Dobson; Aaron has 4- against an EAP grade of 3-. That is 1 whole grade above, or 3 sub-grades, counting 3=, 3+ and 4-.
- Howarth; Alfie has 3= against 5+: 2 whole grades and 7 sub-grades below.
- Fairbrother; Connor has 3- against 3-, so both differences are 0 and his grade is light green.
- Heaton; Aimee has 6+ against 6=: the same whole grade, but 1 sub-grade above. With Sub, her grade counts as above track.
With Compare
Section titled “With Compare”With Compare, each pupil gets a second row, such as KS4 Targets >, with the second data set’s grade, points and residual. Two columns are added: Grade Points (Diff) and Subject Progress Index (Diff).
| Colour of the first row | Meaning |
|---|---|
| 4- ↑ light green, up arrow | Higher than the second row |
| 3= ↓ pink, down arrow | Lower than the second row |
| No colour | The same |
Against their KS4 targets, Dobson; Aaron’s 4- is above a target of 3, with Grade Points (Diff) of 1.00. Howarth; Alfie’s 3= is 3.00 points below a target of 6. Barraclough; Abbie’s 6= against 6 is not coloured. Fairbrother; Connor’s 3- against a target of 3 is pink. With Sub, a 3- is below a whole 3, although the points are the same.
Points to watch
Section titled “Points to watch”An EAP grade is your school’s expectation, not a forecast. A pupil below it is a reason to look at their work, not a judgement of the pupil or the teacher. What the evidence says about flight paths explains why.
Check that the grades and the EAP mean the same kind of thing. Working-at grades compared with a flat pathway of targets put most pupils below track early in a course.
Matrix
Section titled “Matrix”The Matrix counts the pupils at each KS2 score who got each grade in one qualification. It works at Students level and needs a Qualification.
Read the report
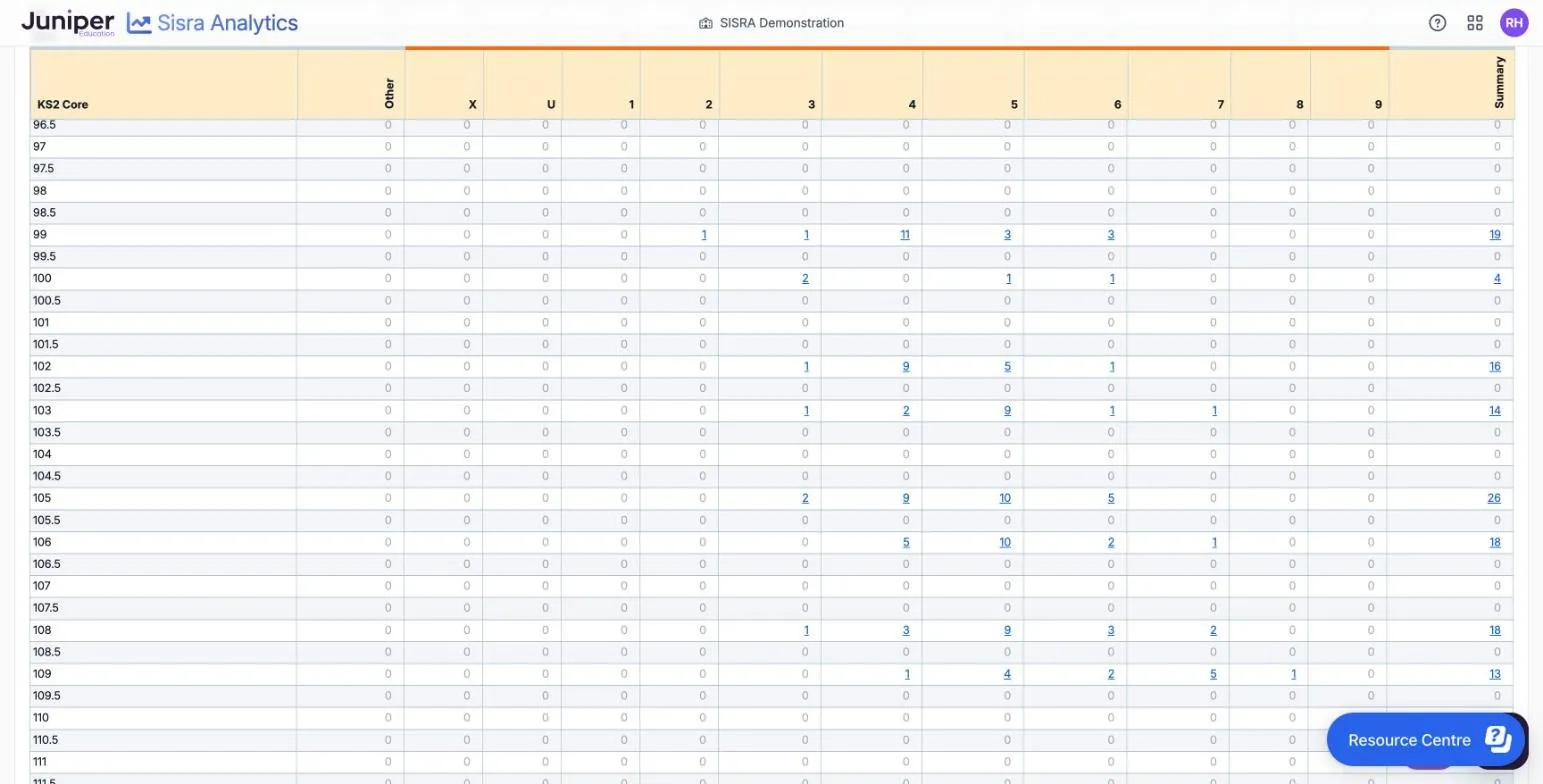
Section titled “Read the report”The rows are KS2 Core scores, in half points from 59 to 120. For English and maths qualifications this is the pupil’s KS2 score in that subject, and for others the average of the two. N/Other collects KS2 results that are not scores. Pupils with no KS2 result are left out.
The columns are the grades, from Other, X and U to 9, then Summary. Each cell is a number of pupils: select it to see them. Most cells are 0, because each half point has its own row.
In the 25/26 maths results, 26 pupils have a KS2 maths score of 105. Of them, 2 got grade 3, 9 got 4, 10 got 5 and 5 got 6. The Summary row counts 202 of the 210 pupils, leaving out the 8 with no KS2 score. The KS2 scores are the demo school’s own, not official.
With Compare, each row gains a KS4 Targets > row and a Difference > row.
Comparison Matrix
Section titled “Comparison Matrix”The Comparison Matrix counts pupils by their grade in two data sets, for one qualification, such as exam results against targets. It works at Students level. Choose a second data set with Compare and a Qualification: until you do, it asks for both.
Read the report
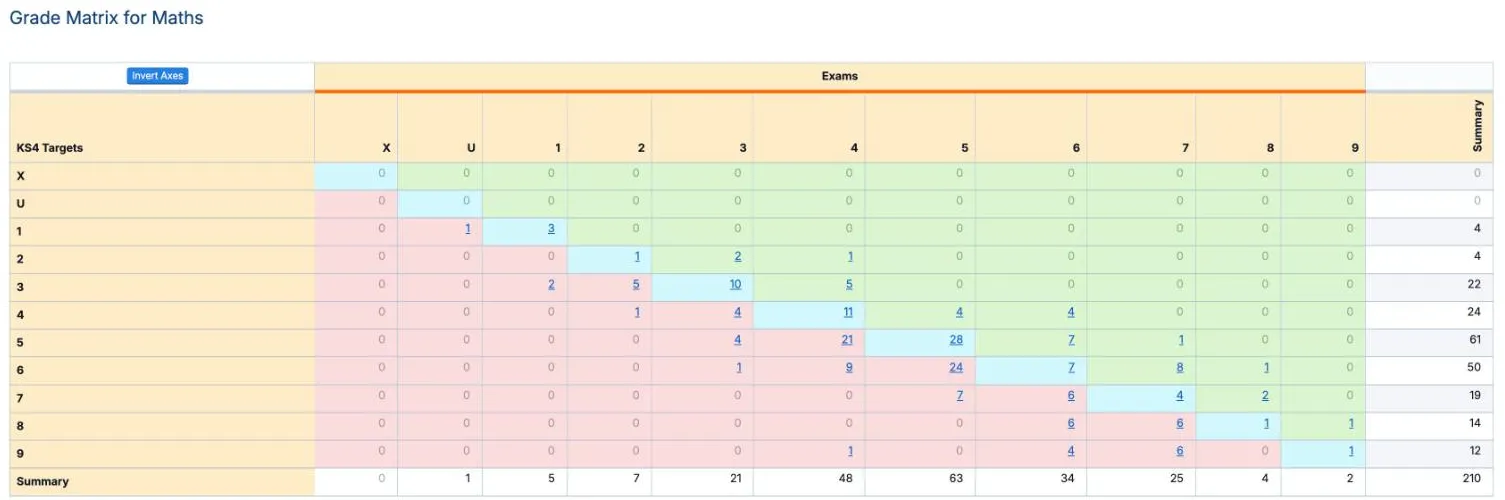
Section titled “Read the report”The rows are the grades in the second data set and the columns the grades in the one you are viewing. Invert Axes swaps them. The Summary row and column give the totals.
| Colour | Meaning |
|---|---|
| Blue | The same grade in both data sets |
| 7 light green | A higher grade in the data set you are viewing, such as above target |
| 4 pink | A lower grade |
In the 25/26 maths results against KS4 targets, 66 pupils are on target. The blue cells add up to 3 + 1 + 10 + 11 + 28 + 7 + 4 + 1 + 1 = 66. Another 36 are above target and 108 below: 66 + 36 + 108 = 210. Of the 61 pupils targeted grade 5, 28 got it, 8 did better and 25 got grade 4 or 3.
Points to watch
Section titled “Points to watch”The colours are clearest when both data sets use the same grade method. With sub-grades, Sub and Whole decide whether a 5- counts as below a target of 5.
Transition Matrix
Section titled “Transition Matrix”The Transition Matrix shows, for each KS2 level, the percentage of pupils who got each grade in one qualification. It sets these against the same figures in the Data Collaboration. It works at Students level and needs a Qualification.
It is only for cohorts with KS2 results in the old national curriculum levels: the 2019 to 2020 leavers and earlier. For later cohorts the Students button is greyed out, with a message that begins “Due to a lack of DfE guidance for Scaled Score cohorts”.
Options
Section titled “Options”| Option | What it does | Default |
|---|---|---|
| Actual and Difference icons, on the DATA COLLAB bar | Show your percentages, coloured against the collaboration’s, or the differences as numbers | Actual |
| Displaying Collab. Data : | Shows or hides the collaboration’s own rows | Hiding |
| Standard : or Cumulative : | Single grades, or ranges from the top grade | Standard |
Read the report
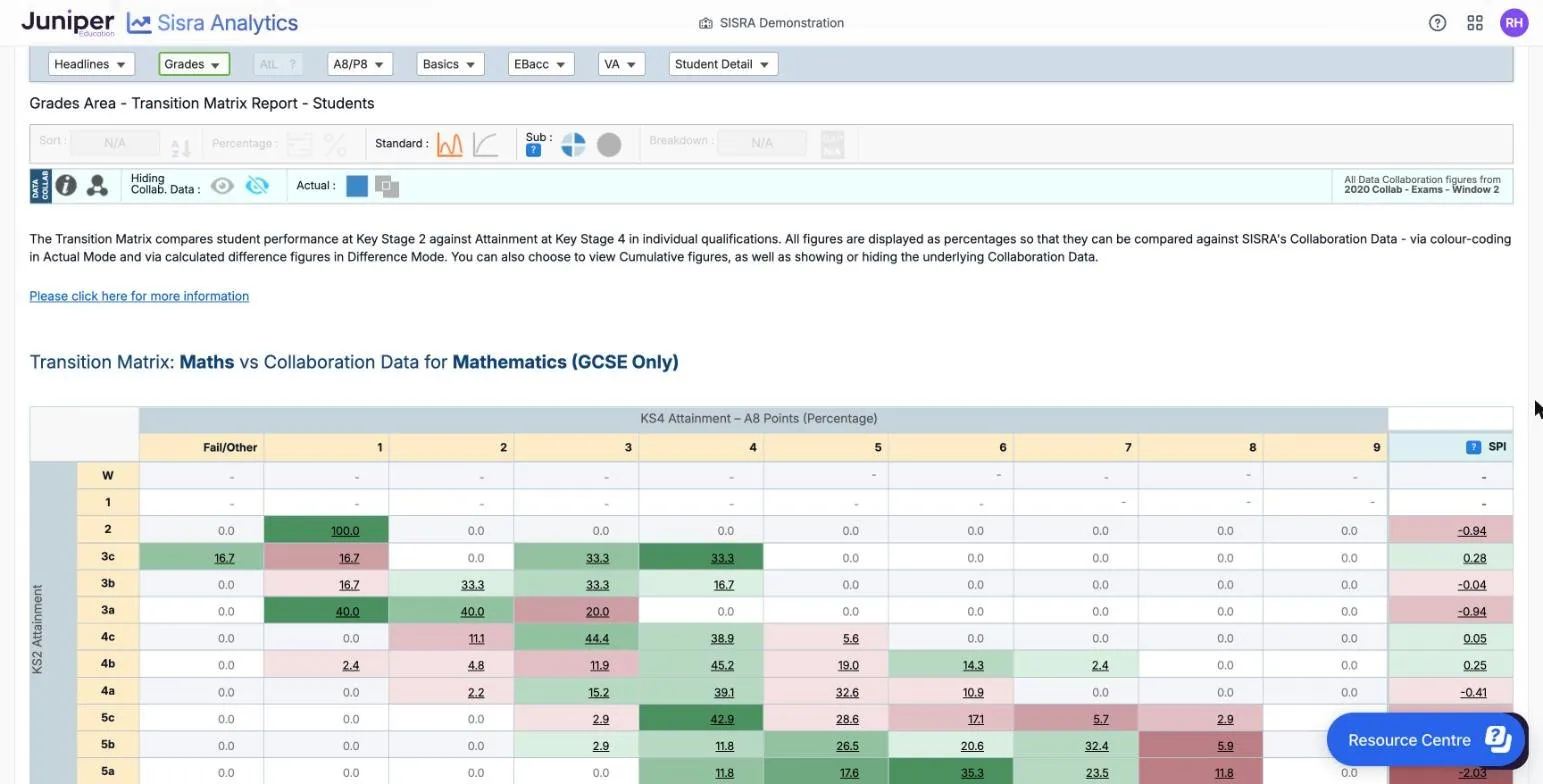
Section titled “Read the report”The heading names the collaboration subject group, such as “Transition Matrix: Maths vs Collaboration Data for Mathematics (GCSE Only)”. The rows are KS2 Attainment levels, from W and 1 to 5a. The columns are KS4 Attainment – A8 Points (Percentage), from Fail/Other to 9, then SPI. Each row’s percentages add up to 100.
In the demo school’s 19/20 maths results, 45.2% of pupils with KS2 level 4b got grade 4. Another 19.0% got grade 5 and 14.3% grade 6, and the row’s SPI is 0.25.
Points to watch
Section titled “Points to watch”The shading shows whether a percentage is higher or lower than the collaboration’s for the same cell, not whether it is good news. Each darker shade means another 5 percentage points of difference, up to 20 or more. Take the demo school’s 5a row, the pupils with the highest KS2 results. Its cells for grades 4 to 7 are green, while the row’s SPI is −2.03. Read the SPI column, or switch to Difference.
SPI Scattergraph
Section titled “SPI Scattergraph”The SPI Scattergraph plots each pupil’s grade in one qualification against their KS2 score, with a line for the average in the Data Collaboration. It works at Students level and needs a Qualification.
Read the report
Section titled “Read the report”Each blue dot is one or more pupils, placed by KS2 Prior Attainment across and A8 Points in the qualification up. The grey line is the Collaboration Data Average: the average points of pupils with each KS2 score in the collaboration. A dot above the line has a positive SPI, and the further above, the higher. Pupils with no KS2 score sit at N and have no SPI.
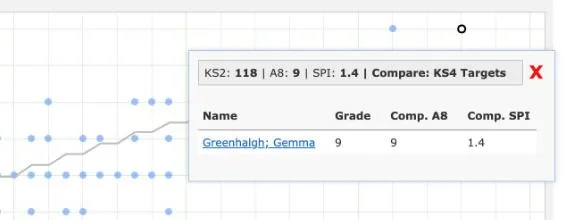
Select a dot to see the pupils in it, with their Grade. With Compare, the box also gives each pupil’s Comp. A8 and Comp. SPI from the second data set. Below the chart, a table gives the collaboration’s average points for each KS2 score, and the subjects in the collaboration group.
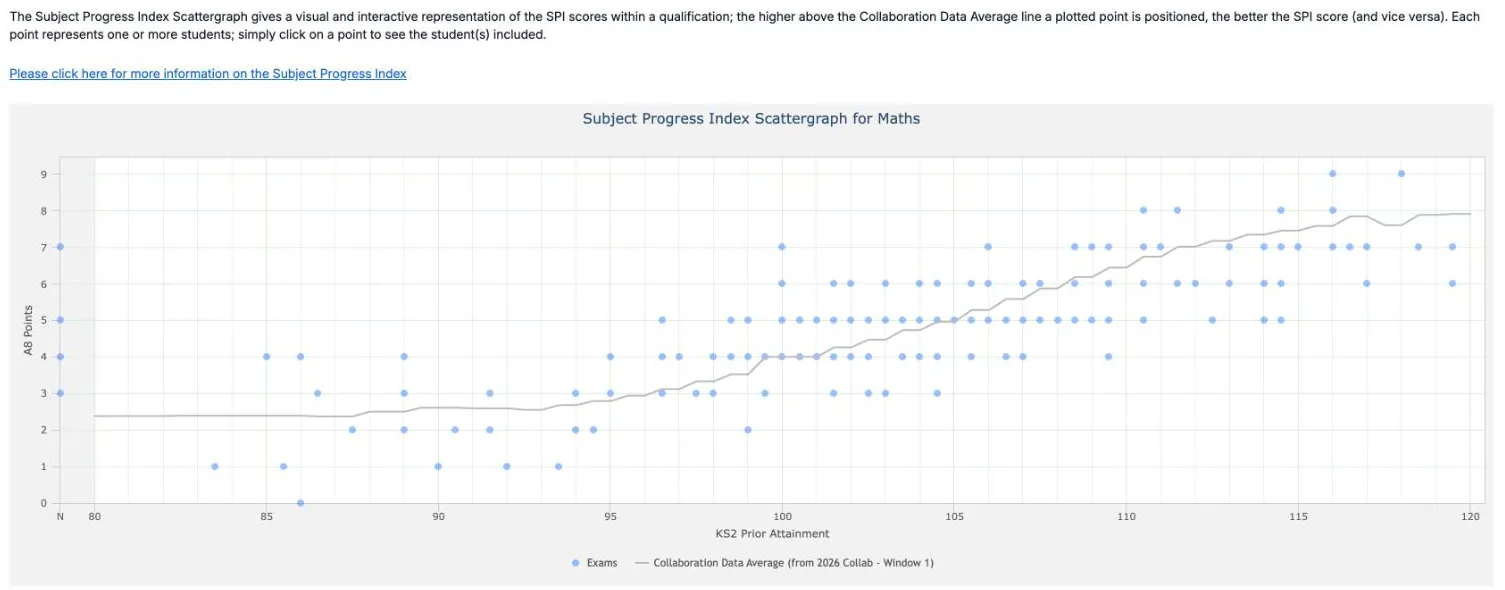
In the 25/26 maths results, a selected dot at KS2 118 and grade 9 has an SPI of 1.4. So the collaboration’s average for pupils with a KS2 score of 118 is 9 − 1.4 = 7.6 points. Below the chart, the collaboration’s average is 2.38 points at a KS2 score of 80 and 4.00 at 100. It is 6.44 at 110 and 7.91 at 120.
Points to watch
Section titled “Points to watch”For the 25/26 cohort, both the demo school’s KS2 scores and the 2026 collaboration’s rest on converted scores, not KS2 tests. Subject Progress Index explains where SPI comes from and when it is blank.