


 Sonar Tracker
Getting started
Get started as a pastoral leader or SENCO
This tutorial shows heads of year, pastoral leaders and special educational needs coordinators (SENCOs) how to look at groups in Sisra Analytics. It covers groups such as pupils with special educational needs (SEN) and disadvantaged pupils, then Attitude to Learning (AtL), then individual pupils and students. Work through it with Sisra open.
The examples come from Juniper Education’s demo school. Its 26/27 cohort is this year’s year 11, and its 25/26 cohort left year 11 in summer 2026.
Before you start
Section titled “Before you start”You need:
- a Sisra account, which you sign in to through Juniper Portal with your work email address (see Sign in and switch schools)
- an authority group with View Student Report, to see named pupils and students. The User group has it
- to know which filters your school imports, such as SEN, Disadvantaged and Attendance Group, and which focus groups it has
Filters come from your school’s management information system (MIS), in the student data your Sisra administrator imports. Every report uses the latest published student data. So a filter shows each pupil’s value now, not their value when the grades were collected. A pupil added to the SEN register in spring counts as SEN in last autumn’s report too.
See who is in a cohort
Section titled “See who is in a cohort”- Select REPORTS, then the KS 3/4 tab, then the cohort’s tab, such as 26/27 (Yr 11).
- Select the key icon on the right of the cohort’s panel.
Key Characteristics opens. For each filter, it gives the number and percentage of pupils with each value. In the demo school’s 26/27 cohort, 210 pupils are on roll. Of them, 49 (23%) are disadvantaged, 34 have SEN support and 2 have an education, health and care plan (EHCP).
Inside a report, the same key icon describes only the pupils in the report, after any filters. It has an Export button.
Look at a group with filters
Section titled “Look at a group with filters”- On the reports home, expand a report and select Students under Grades. The report has a row for each pupil.
- Select the Filters tab, then Add Filters.
- Tick the values you want, such as SEN Support and EHCP under SEN.
- Select Apply.
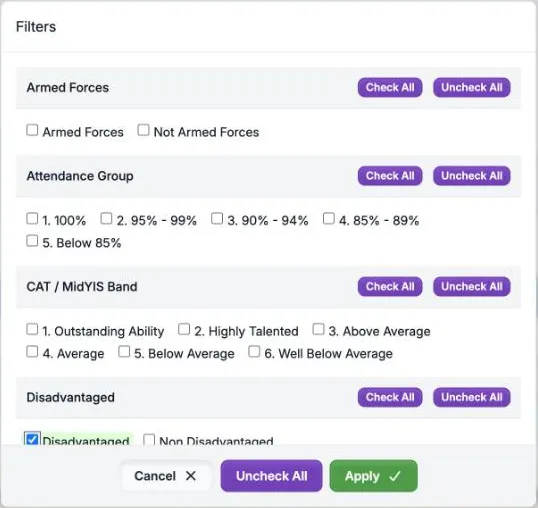
The button now reads Add/Remove Filters, and the key icon shows how many pupils are left. Every figure in every report is then worked out for those pupils only, until you remove the filter. Sisra keeps your filters for up to 48 hours, so check the Filters tab for a green number before you read a figure.
How Sisra combines your choices:
| You tick | The report includes |
|---|---|
| Two values in one filter, such as SEN Support and EHCP | Pupils with either value |
| Values in two filters, such as Disadvantaged and SEN Support | Only pupils with both |
| Two focus groups | Pupils in either group |
Filters do not change the Sisra Data Collaboration figures, which stay those for all pupils in the collaboration. To compare a group with the same group elsewhere, use Breakdown : on the toolbar with a key filter, such as Disadvantaged or SEN. Breakdown and GAP explains how.
The Measures tab finds pupils by headline measure. For example, choose Exclude for Pupils Included (Progress 8 Coverage) to list the pupils with no KS2 score. To leave guests out of a Grades report, tick On Roll under Student Status.
Use focus groups
Section titled “Use focus groups”A focus group is a list of pupils or students chosen by hand, such as an intervention group. Someone with Access Data Section, usually your data manager, sets them up. In the reports, they appear under Focus Group in the Filters tab. In the demo school’s 26/27 cohort, the Intervention Group has 1 pupil, described as “50% subjects below track”.
Focus groups work only in the Filters tab, not in Breakdown : or at the Filters level of a report. A KS3/4 cohort can have one default group, whose members are highlighted in the reports. See Set up focus groups and report filters.
Read small groups with care
Section titled “Read small groups with care”Many groups are small. In the demo school, 2 pupils have an EHCP, so each is half the group. Give the number of pupils with every percentage, such as 1 of 2 pupils (50%), and look at each pupil’s work rather than an average. Take care with small groups explains why.
Look at Attitude to Learning
Section titled “Look at Attitude to Learning”Attitude to Learning judgements are collected with the grades, in categories your school chooses, such as Attitude, Behaviour and Organisation.
- Open a report, then select AtL on the area bar, then Overview.
- Choose a level, such as Qualifications or Students.
- On the AtL tab, choose the AtL Category, such as Behaviour.
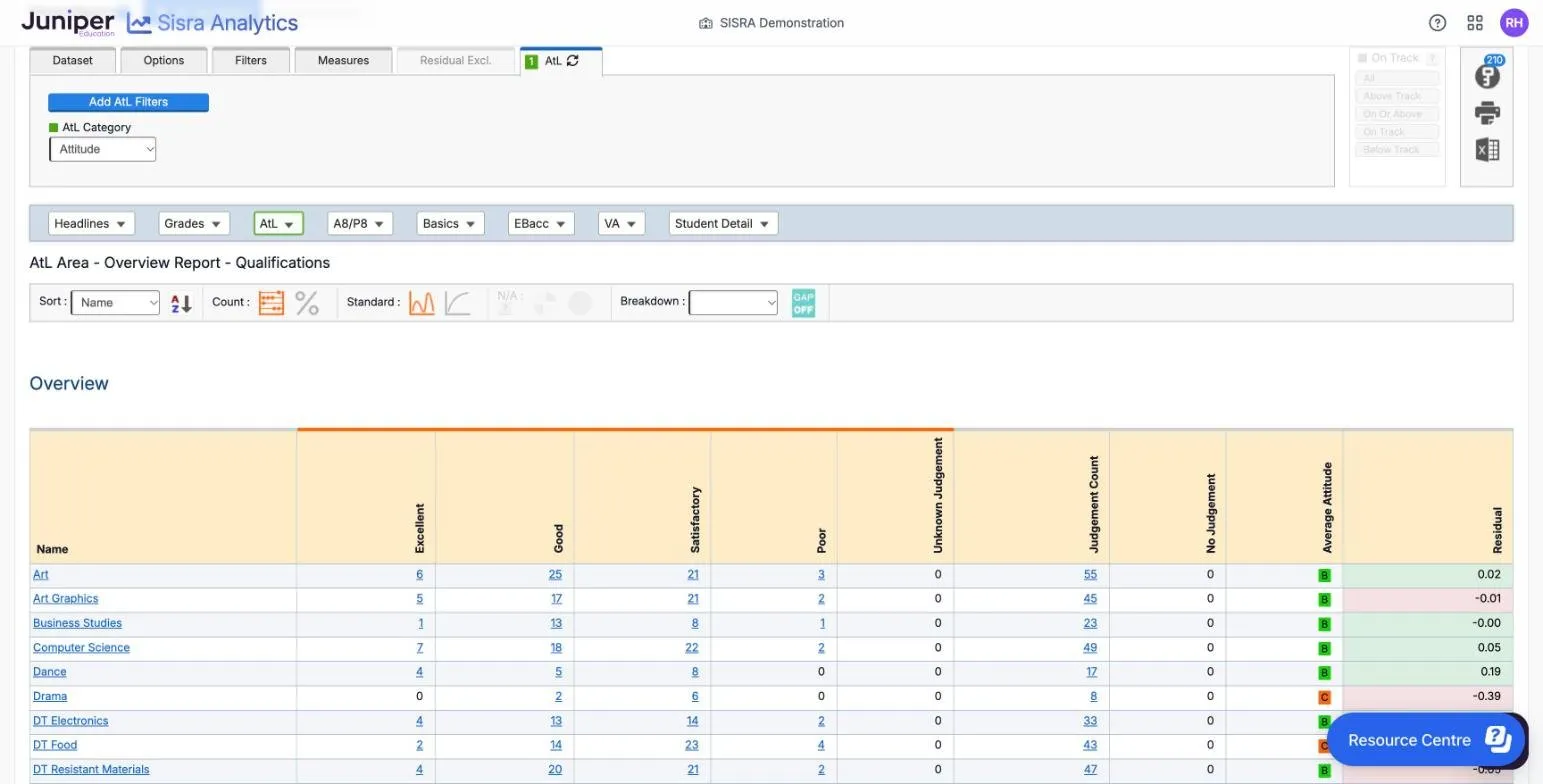
Each row counts the judgements of each kind and shows their average as a letter. In the demo school, A (Excellent) is blue, B (Good) green, C (Satisfactory) orange and D (Poor) red. Residual compares the pupils’ judgements in that row with their judgements in their other subjects. In the Y10 Summer collection, drama’s 8 judgements average C, with a residual of −0.39. Across all subjects, the 1,969 judgements average B.
At Students level, each row is one pupil across all their subjects. To see only the grades given a judgement, such as Poor for Behaviour, select Add AtL Filters on the AtL tab. Tick the judgement, then select Apply. The filter works in the Grades and Student Detail areas too.
A judgement appears only where the pupil has a grade in that subject. The AtL area is greyed out for a data set with no judgements. AtL explains the report.
Look at one pupil
Section titled “Look at one pupil”The Grades Totals report at Students level gives one row for each pupil across all their subjects. It shows their average points, their average AtL judgements and how many grades are above, on and below their expected grades. Tags under names, such as Disad, ATT and EHCP, are your school’s markers for filter values.
Select a pupil’s name to open their Student Detail Overview.
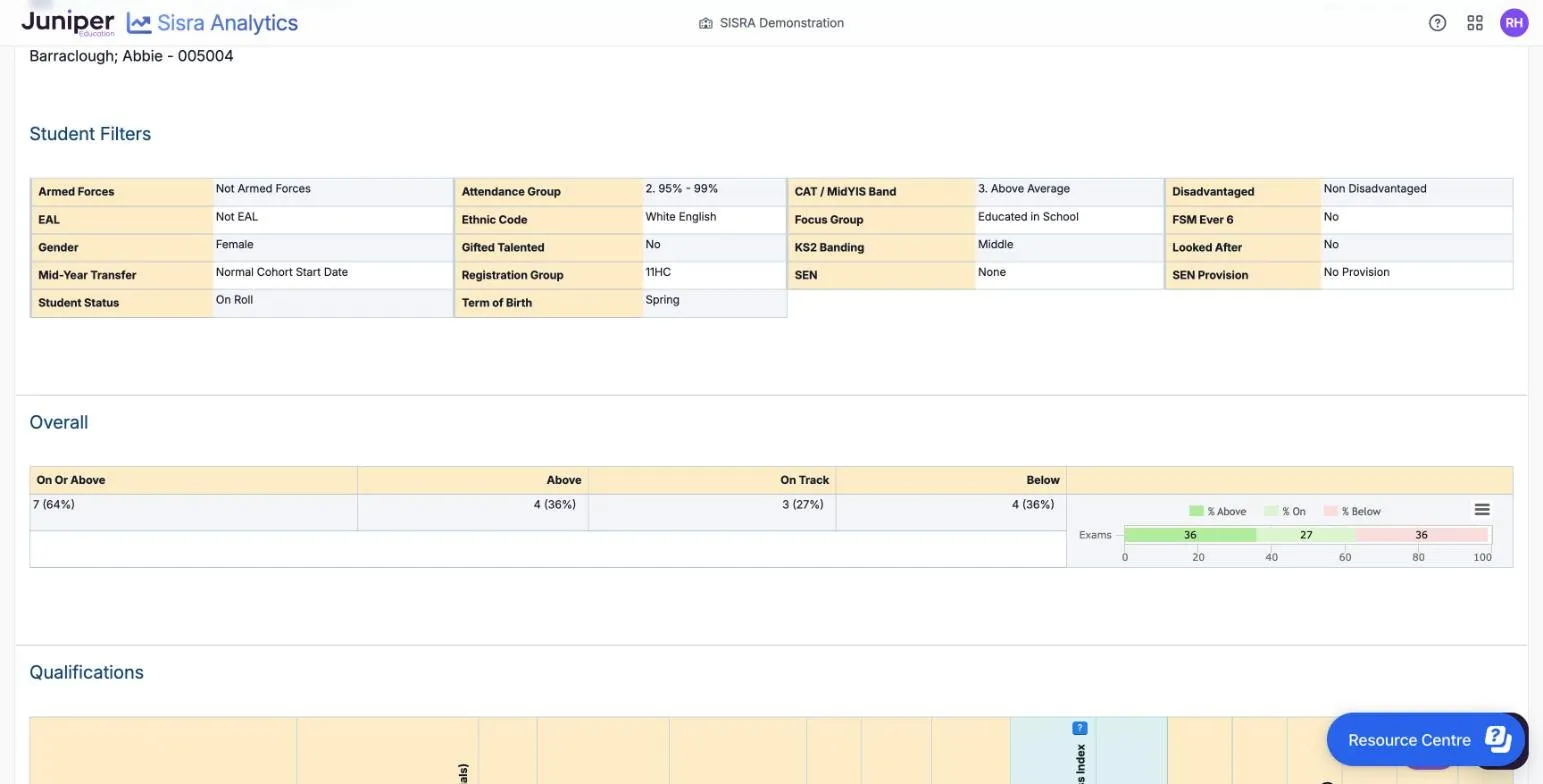
Student Filters lists the pupil’s value for each filter your school shows there, such as SEN, SEN Provision and Focus Group. Overall counts their grades above, on and below their expected grades. In the demo school’s 2026 results, Barraclough; Abbie has 7 of 11 grades (64%) on or above. Below, Qualifications lists each subject with its grade, expected grade and AtL judgements. Student Detail reports explains each section.
Look at sixth form students
Section titled “Look at sixth form students”At KS5, select REPORTS, then the KS5 tab, and choose the cohort and DATA SET. Then:
- the Key Characteristics button gives the cohort’s numbers. The demo school’s 26/27 cohort has 181 students On Roll and 1 Year 12 Only, and 44 (24%) are disadvantaged
- Students, under SHORTCUTS, opens a row for each student, with their filter tags, average grade, value added, AtL averages and track figures
- AtL, under STANDARD REPORTS, counts the judgements by qualification. It appears only for data sets with judgements
To narrow a report to a group, select ADD FILTER. The Filters panel has tabs for Student Filters, Focus Groups and AtL.
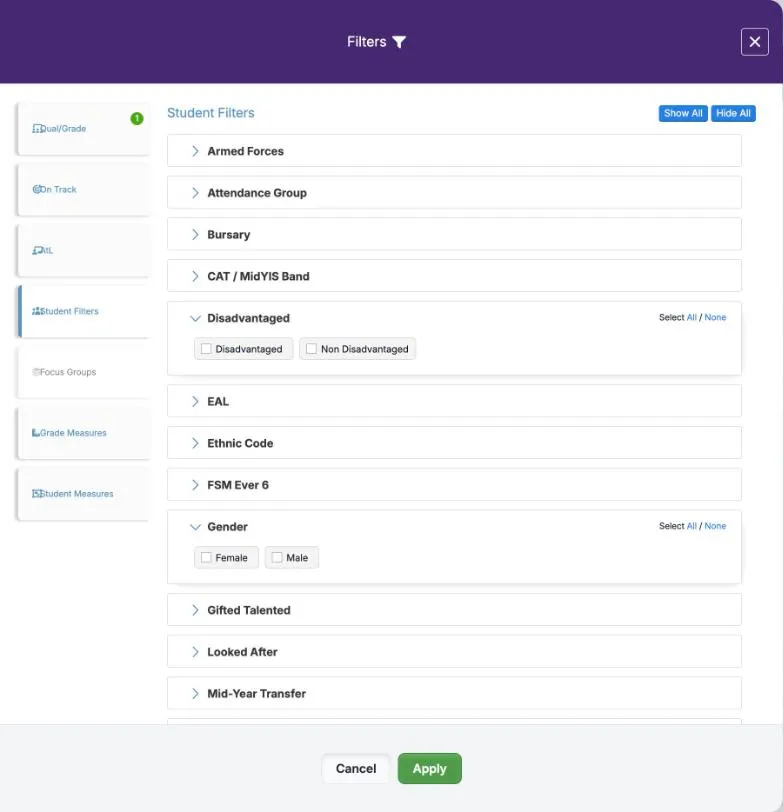
Tick the values, then select Apply. Each filter shows as a box beside ADD FILTER, with a cross to remove it. Select a student’s name to open a panel with Student Information, which lists their value for each filter your school shows there. Next Student > moves through the list. See Student reports and Grade Analysis and AtL reports.
Keep pupils’ and students’ data safe
Section titled “Keep pupils’ and students’ data safe”Reports and exports hold personal data, including SEN details. Store, share and delete exports and printouts as your school’s data protection policy says. The DfE’s 2025 accountability guidance says “Schools should not share individual pupil progress scores with pupils or parents”. So talk with families about work and grades, not progress scores.