


 Sisra Analytics
Reports
Find and run reports
The Reports page is Sonar’s report library. Choose a report and the pupils, then set the assessment points, subjects and options you need. You can bookmark a report you use often, and print any report or save it as a PDF.
Before you start
Section titled “Before you start”All roles can open reports, but the list you see depends on:
- your school’s subscription: with Sonar Lite, Reports shows a crown icon and an information page instead of the library
- your role, which can hide some newer reports
- the assessments your school uses: a report appears only if your school records the data it reports on
The Minimal Read-only role, meant for governors and visitors, sees pupil names anonymised. See Users and roles.
Reports count the judgements entered so far. Sonar does not carry judgements forward, so a pupil with no judgement at an assessment point counts as No Assessment. Before a meeting, check entry with the Summative Data Check Summary.
Find a report
Section titled “Find a report”- Go to Reports.
- Under What are you trying to achieve?, select the goal closest to your task, such as Pupil Progress.
- To narrow the list, enter part of the report’s name in Search Reports, or choose from the Roles, Phase or Assessment Type lists.
- Select the report’s card.
The page opens on All Reports. Each card shows the report’s name, a short description and tags for the data it uses, such as Summative or Statutory.
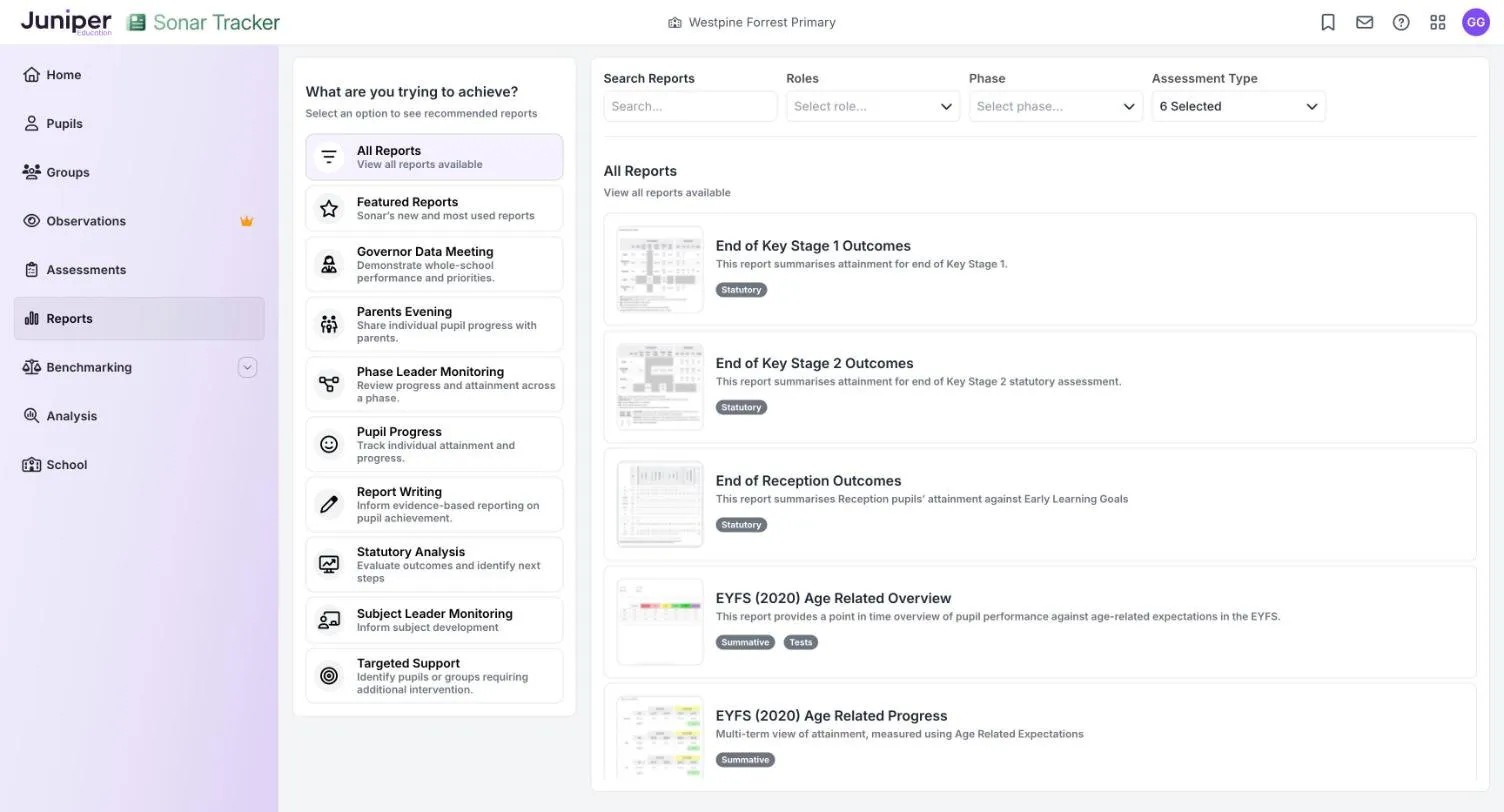
Each goal shows a shorter list of suggested reports. Governor Data Meeting, for example, includes Age Related Overview, Assessment Conversion Matrix and Primary Flight Path. To start from the question you want to answer instead, see Choose the right report.
Roles shows the reports suggested for a role, such as Primary Teacher or Governor, but does not change who can open them. Assessment Type filters by the tags on the cards and starts with all six ticked (6 Selected). To remove a choice in Roles or Phase, choose Clear at the top of the list.
Most reports come in a primary and an EYFS version, such as Primary Venn and EYFS (2020) Venn. Older EYFS reports have (2020) in their names and newer ones do not.
Open a report for your pupils
Section titled “Open a report for your pupils”After you select a report, a Select Pupils box opens.
- Choose a year group from the Year Group list, or a class from the Class list.
- Select Load Report.
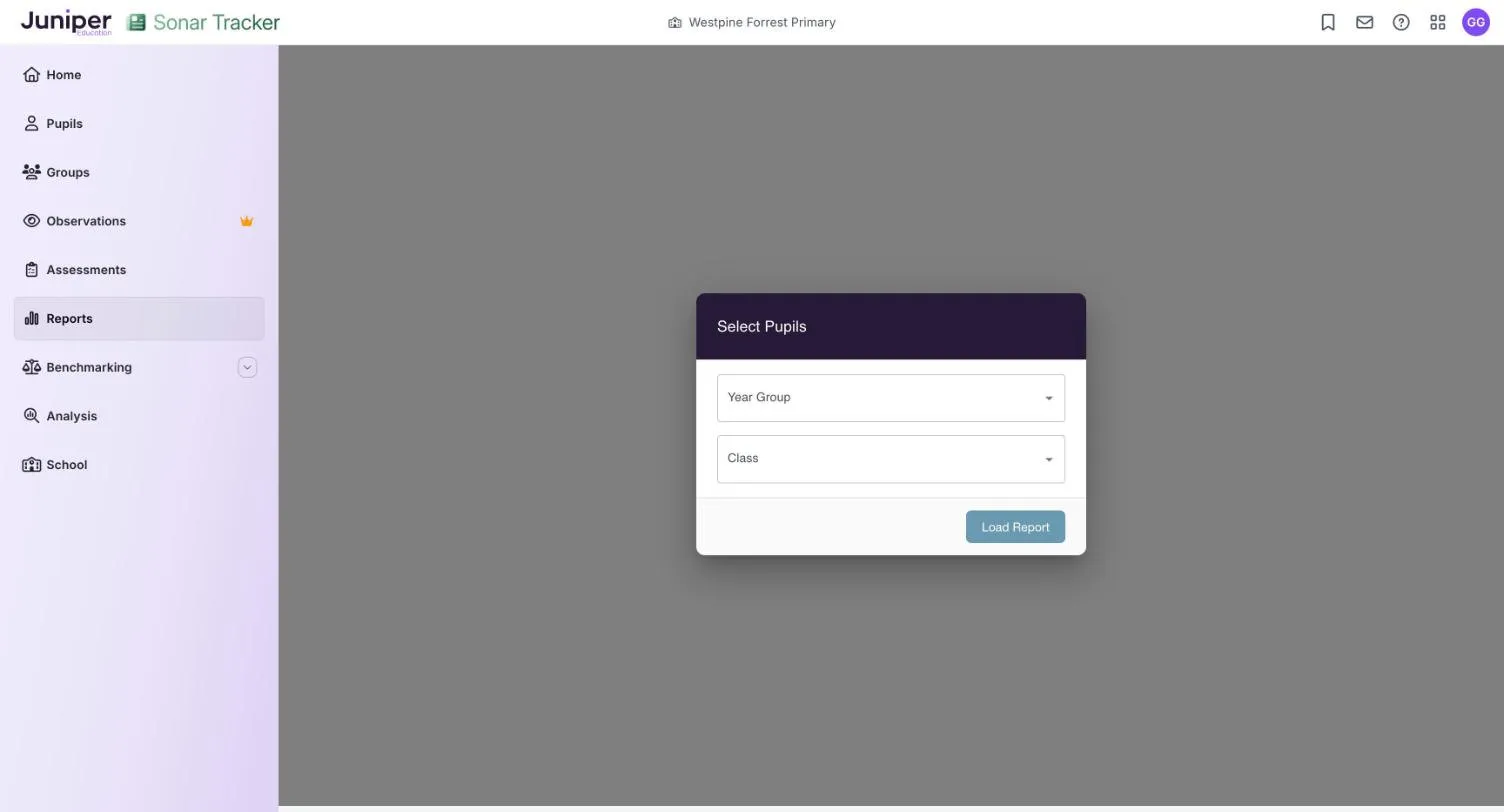
Choose a year group or a class, not both. The Class list includes classes with no pupils, so a year group and a class that do not match can return no pupils. For a custom group, such as an intervention group, load its year group, then filter to the group: see Create and manage groups. Single Pupil Overview works differently: it has a third list, Pupils, and opens as soon as you choose a pupil.
A report opens at the current assessment point. Reports that compare two points start from the last point of the previous academic year, such as summer 2.
The year group always means the pupils’ current year group. For example, choose Year 4 and look back to summer 2 of the 2025 to 2026 academic year. You see this year’s year 4 pupils with their year 3 judgements.
To save choosing your class each time, set a preferred year group or class on Home, which Sonar then loads for you. See Set your preferences.
Older and newer report screens
Section titled “Older and newer report screens”Like the assessment pages, reports come in two generations of screen, with different controls.
Older reports
Section titled “Older reports”Most reports use the older screen, with a coloured bar across the top.

| Control | What it does |
|---|---|
| Report run on | When the report was produced. Select the refresh icon beside it to add judgements entered since. |
| Active Filters | How many filters apply, such as 2 Active Filters for your year group with leavers excluded. Select it to open Pupil Filters, make your choices, then select Apply Filters. |
| Assessment point lists | A year and a term for one-point reports, From: and To: for two-point reports, or a list such as 2 Periods |
| Subjects | The subjects to include, such as 3 Subjects. Most primary reports start with reading, writing and maths. |
| Display Options | Turns parts of the report on and off (see Change what a report shows) |
| Saves the report as a PDF |
A line under the toolbar repeats your choices, for example “2026-2027 | Autumn 1 | Summative against ARE | Year 4 | Not Leaver | (28 Pupils)”.
In most older reports, select a figure to list the pupils behind it, then a pupil’s name to open their Single Pupil Overview. Select the figure again to hide the list.
Newer reports
Section titled “Newer reports”Primary Pupil Progress Meeting, Primary Flight Path and Primary Triangulation of Data Analysis use the newer screen. So do EYFS Good Level of Development Tracking and both versions of Characteristic Attainment Overview, Summative Data Check Summary and Cohort Formative Analysis.

| Control | What it does |
|---|---|
| Filters | Opens the Filters panel. Choose filters on All Filters, then select Save. |
| Assessment point and subject lists | Set the point and the subjects |
| Saves the report as a PDF | |
| Opens your browser’s print window | |
| Pupil counts | The first count, such as 28 Pupils, is everyone in the report. The second, such as 0 Pupils With No Assessment, counts pupils the report has no judgement for. |
| Summary line | Lists the assessment point, year group, leavers setting and subjects |
Newer reports have no refresh icon and no Display Options. Reload the page to see new judgements, and select the arrows in a column heading to sort by that column.
Filter names differ slightly between the two screens, such as In Care on newer reports and In LA Care on older ones. Filter pupils lists the differences.
Change what a report shows
Section titled “Change what a report shows”On older reports, Display Options turns parts of the report on and off. Each report offers some of these options.
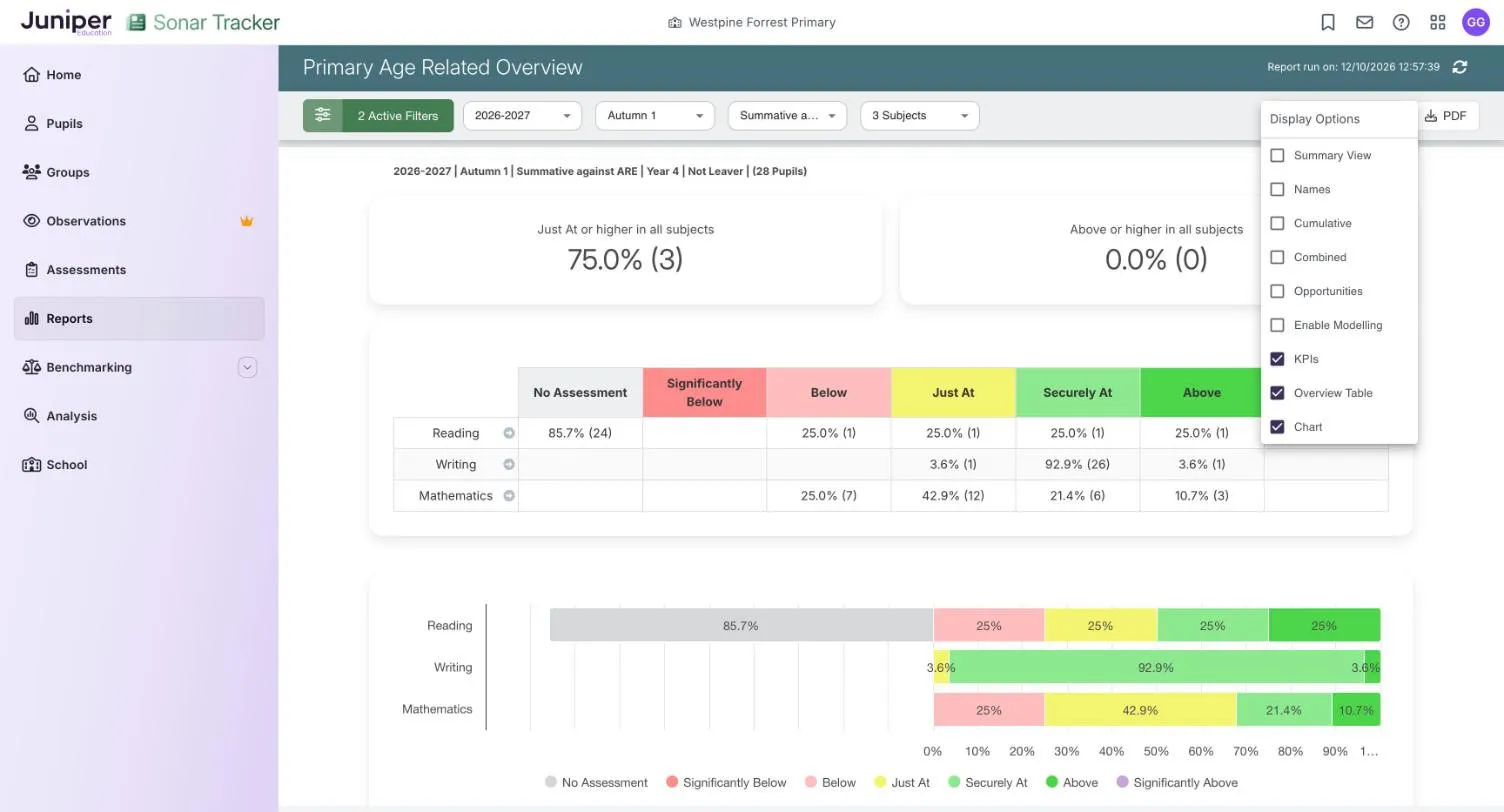
| Option | What it does |
|---|---|
| Summary View | Splits the figures into rows for pupil groups, such as boys, girls, disadvantaged pupils and pupils with special educational needs (SEN) |
| Names | Lists the pupils in each cell. Long lists end with a link such as show 15 more. |
| Cumulative | Makes each cell include the higher judgements too, so Securely At also counts pupils who are Above or Significantly Above |
| Combined | Adds measures across all the subjects shown, such as pupils who are Just At or higher in every one |
| Not On Track | Adds the pupils below Just At |
| Opportunities | Counts, for each subject, the pupils who are on track in every other subject shown but not in this one |
| Enable Modelling | Works with Opportunities to show how the headline figures would change if those pupils reached the expected level |
| KPIs, Overview Table, Chart, Pupil Table | Show or hide the headline figures, the main table, the chart and the table with a row for each pupil |
| Table | Lists the pupils in each part of the diagram (Venn only) |
| Separate Classes, Separate Year Groups | Repeat the report for each class or year group, when you load more than one |
Options that show a part of the report, such as KPIs and Chart, start ticked, and the rest usually start unticked. Attainment reports and Progress reports list the options each report has.
Bookmark a report
Section titled “Bookmark a report”A bookmark saves a report with its settings and filters, so you can open it again in one step.
- Open the report and set it up with the pupils, subjects and filters you want.
- Select Bookmarks in the top bar.
- In Bookmark this Page, enter a name, such as
Year 4 reading autumn 1. - Select Save Bookmark.
The button reads Please enter a Title until you enter a name. The bookmark then appears in the Bookmarks panel on Home, under Reports.
Print a report or save it as a PDF
Section titled “Print a report or save it as a PDF”Select PDF to save the report as a PDF file. It goes to your computer’s downloads folder, not to your Inbox. To print an older report, print the PDF.
Newer reports also have Print, which opens your browser’s print window. If the report is cut off, choose More settings and change Scale.
Before you share a report beyond the staff, check whether it shows pupil names. Reports such as Primary Flight Path list every pupil, and Names adds names to older reports.
Copy a report into Excel
Section titled “Copy a report into Excel”Tables from some older reports, such as Subject Overview, Summative Progress Analysis (ARE) and Target Analysis, can be copied into Excel as text. Copy a report into Excel gives the steps, which stop Excel reformatting the figures. For assessment data across the school, use the Pupil Data Export Wizard instead: see Export pupil data.
If something goes wrong
Section titled “If something goes wrong”A report is missing from the list. Clear Search Reports, Roles and Phase, check that Assessment Type shows 6 Selected, and select All Reports. If it is still missing, your school’s subscription or your role may not include it. Staff with accounts at more than one school may not see some newer reports in every account. Contact Juniper support.
The report shows no pupils. Check that the year group and class you chose match, then check the filters. Leavers are left out unless you change the Leavers filter.
New judgements do not show. On an older report, select the refresh icon in the coloured bar. On a newer report, reload the page.
The percentages add up to more than 100%. Reports treat pupils with no judgement in different ways. Each report’s section in this guide explains its percentages, and Report figures do not match compares them.
A card or button does not respond. Select it again. The first selection after a page loads is sometimes missed.