


 Sisra Analytics
Reports
Formative reports
Formative reports summarise the codes teachers record against curriculum objectives on Primary Formative and EYFS Formative. Each report opens for the year group or class you choose, with leavers excluded.
Formative Progress Analysis
Section titled “Formative Progress Analysis”Formative Progress Analysis gives each pupil’s share of a band’s objectives achieved at two assessment points, and the change between them. Go to Reports, then select Primary Formative Progress Analysis or EYFS (2020) Formative Progress Analysis.
Options
Section titled “Options”| Option | What it does | Default |
|---|---|---|
| From:, To: | The two assessment points | The last point of the previous academic year, and the current point |
| Subjects | The subjects to show | Reading, Writing and Mathematics (EYFS: Literacy and Mathematics) |
| Band list | One or more bands of objectives to count, from Nursery 1 to Band 9 | The band for the year group you loaded, such as Band 4 for year 4 |
There are no Display Options.
Read the report
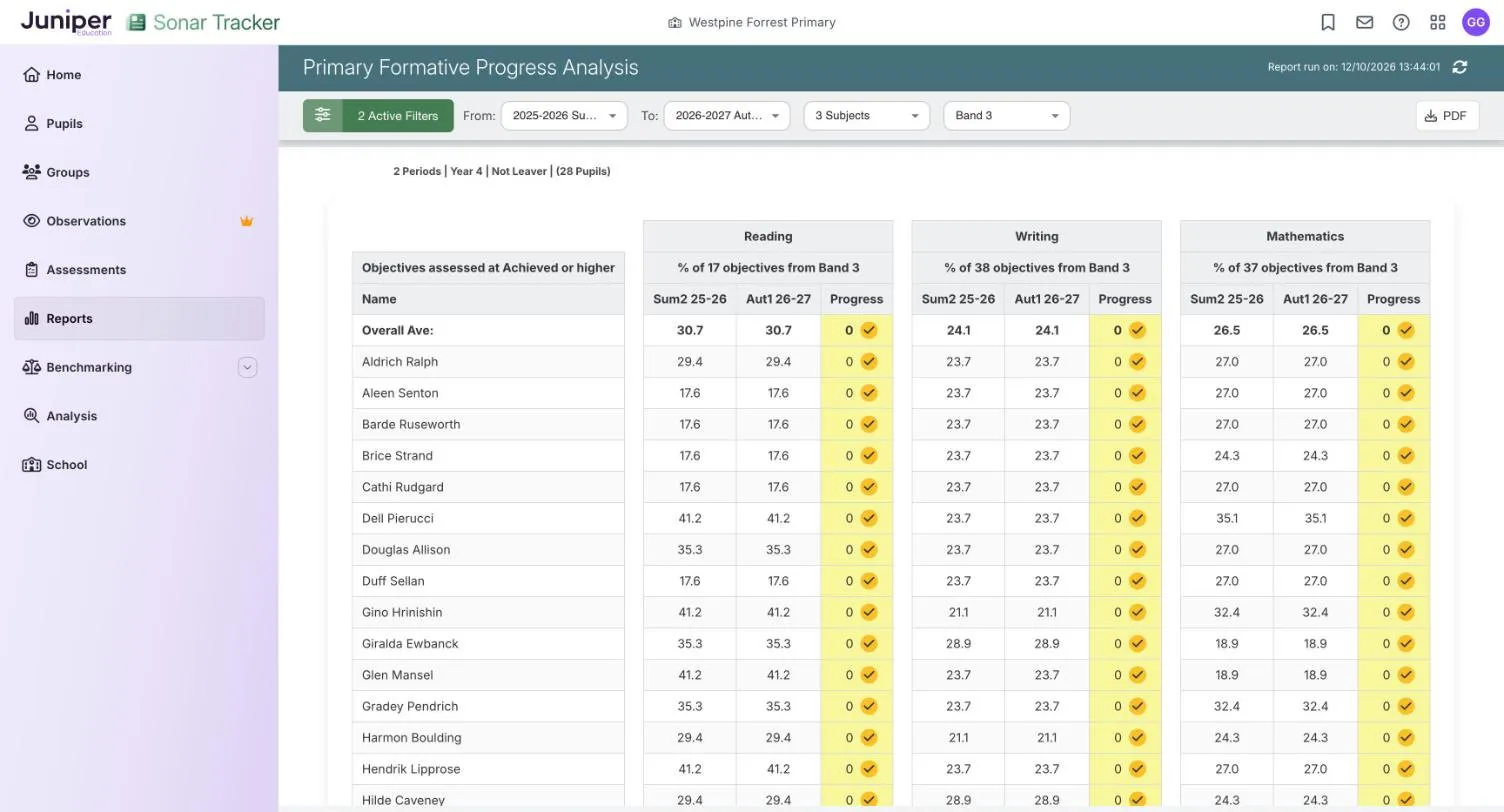
Section titled “Read the report”Each subject’s heading gives the number of objectives counted, such as % of 17 objectives from Band 3. Each pupil has a percentage at each point, under labels such as Sum2 25-26 and Aut1 26-27, then Progress: the difference in percentage points. The first row, Overall Ave:, averages the pupils’ percentages.
A percentage is the share of the band’s objectives coded Achieved or Greater Depth, as the caption Objectives assessed at Achieved or higher says. Working Towards and Taught do not count. There is no key on screen. The Progress cells mean:
| Progress cell | Meaning |
|---|---|
| No change yellow, with a tick | The same share as at the earlier point |
| Higher green, with an up arrow | A higher share achieved |
| Lower red, with a down arrow | A lower share achieved |
In the demo school, year 4 is compared between summer 2 of the 2025 to 2026 academic year and autumn 1. With Band 3 chosen, the report shows last year’s objectives. Dell Pierucci has 41.2 in reading at both points: 7 of the 17 objectives. Progress is 0, yellow with a tick, for every pupil. With the default Band 4, Douglas Allison has achieved 1 of 17 reading objectives by autumn 1, so his progress shows 5.9 in green.
Points to watch
Section titled “Points to watch”The report counts the band you choose, not the band each pupil is working in. With this year’s band chosen, last year’s point usually shows 0.0. To see last year’s objectives, choose last year’s band, such as Band 3 for year 4.
Percentages are of all the band’s objectives, taught or not, so low figures early in the year are normal. Each point uses each objective’s latest code up to then. That is why Band 3 shows the same figures at summer 2 and autumn 1.
Overall Ave: includes pupils with nothing achieved, so it is very low when few pupils have codes: 0.2 for Band 4 reading in the example.
Cohort Formative Analysis
Section titled “Cohort Formative Analysis”Cohort Formative Analysis shows which pupils in a class or year group have secured each objective. Use it to group pupils for re-teaching and to plan next steps. Go to Reports, then select Primary Cohort Formative Analysis or EYFS Cohort Formative Analysis. It covers one year group or one class at a time: choose one in Select Pupils, then select Load Report.
Options
Section titled “Options”| Option | What it does | Default |
|---|---|---|
| Assessment point | The point to report on | The current point |
| Band list | One or more bands of objectives | |
| Subject list | Primary: Art and Design, Computing, Design and Technology, Geography, History, Languages, Mathematics, Music, PE, Reading, Science, Spoken Language and Writing. EYFS: the seven areas of learning. | |
| View Options: View | Pupil gives a row for each pupil. Group gives a row for each pupil group. | Pupil |
| View Options: Strands Shown | Which strands appear | |
| View Options: Assessment Focus | Which codes count in the percentages | All five codes |
| View Options: Show assessment term on cells, Show report description | Label each cell with the term its code was recorded in, or add the report’s description at the top | |
| Print / PDF | Opens your browser’s print window. Set Destination to Save as PDF to save a file. |
Read the report
Section titled “Read the report”There is a section for each band and subject, such as Band 6 · Reading, which you can open and close. Each strand starts as one column with a percentage and the number of objectives: select > on a strand to show its objectives. Each coloured box is the pupil’s most recent code for that objective.
| Colour | Code |
|---|---|
| Not Taught grey | Not taught, or the pupil was absent |
| Taught red | Taught, but the pupil is not yet working towards it |
| Working Towards yellow | Working towards the objective |
| Achieved green | Achieved |
| Greater Depth purple | Achieved at greater depth |
Percentages count Achieved and Greater Depth together. An objective’s figure is the share of pupils who have achieved it, so 20 pupils in a class of 28 shows 71.4%. A pupil’s figure is the share of objectives they have achieved: 9 of 14 shows 64.3%. Strand and band headings give an overall figure for their objectives.
To find pupils who need an objective taught again, sort its column so that pupils coded Taught come first. To see only pupils who need support, set Assessment Focus to Taught and Working Towards. Select the x in a column heading to remove that column.
The Group view shows groups instead of pupils, on three tabs: Characteristics, Ethnicity and Attendance. The Attendance tab has groups such as Attendance Below 90%. Each tab starts with All Pupils and lists only groups with data, and each group’s figures are shares of the pupils in it.
Points to watch
Section titled “Points to watch”The report includes only pupils with an assessment. Pupils working outside their year group appear in the band they were assessed in.
Every objective counts in the percentages, taught or not, unless you untick Not Taught in Assessment Focus. Early in the year, low figures can mean objectives have not been taught yet. In small groups, one pupil moves the figure a long way.
The report is slow with several subjects at once, so start with one. Wide reports split across pages when printed, so remove columns you do not need first.