


 Sisra Analytics
Analysis and benchmarking
Statutory Dashboard
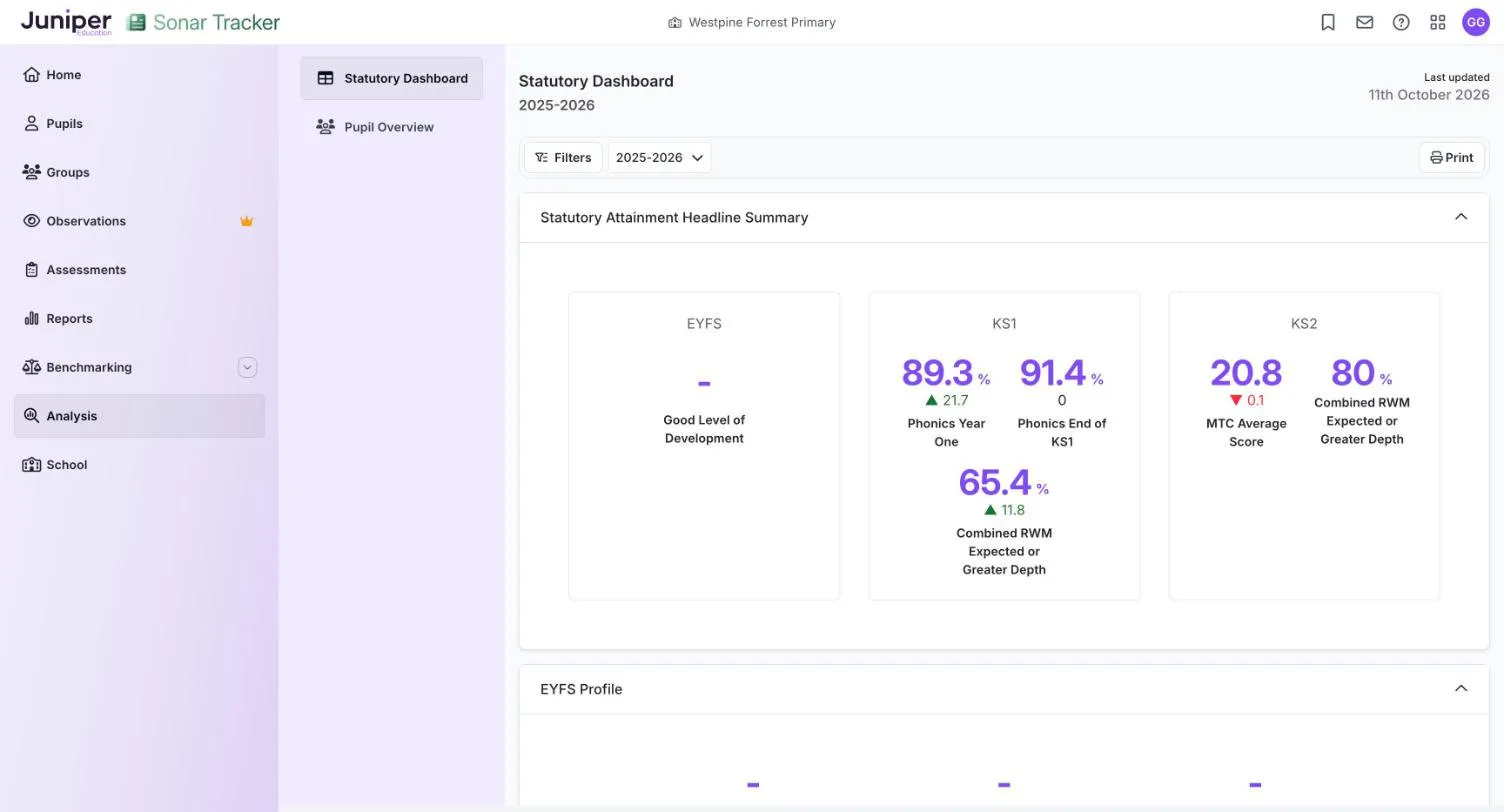
The Statutory Dashboard puts your school’s headline statutory results for one academic year on one page. It covers the EYFS profile, the phonics screening check, the multiplication tables check (MTC), and KS1 and KS2. Most figures show the change from the year before.
Where to find it: go to Analysis, then select Statutory Dashboard.
Who can see it: schools with Sonar Tracker or Sonar Lite. Trusts see the same dashboard across their schools in Sonar Multi-School: see Statutory Dashboard and Pupil Overview.
Options
Section titled “Options”| Option | What it does | Default |
|---|---|---|
| Filters | Narrows the pupils counted, for example to one group | No extra filters |
| Academic year list | Chooses the year whose results are shown | The year with the latest results. In the autumn term, that is the previous academic year, such as 2025-2026. |
The year goes back to the default when you leave the page. Print prints what is on screen, and each section opens and closes from its heading.
Sections
Section titled “Sections”Combined RWM means reading, writing and maths (RWM) together.
| Section | Figures |
|---|---|
| Statutory Attainment Headline Summary | A card for each stage. EYFS: Good Level of Development. KS1: Phonics Year One, Phonics End of KS1 and Combined RWM Expected or Greater Depth. KS2: MTC Average Score and Combined RWM Expected or Greater Depth. |
| EYFS Profile | Good Level of Development, Achieved All Goals and Average Number of Goals |
| Statutory Checks | Phonics Check: Year One, Year Two (retakes) and End of KS1. Multiplication Tables Check: Average Score, Achieved 20/25 or greater and Achieved 25/25. |
| Key Stage One | Expected or Greater Depth and Greater Depth, each for Combined RWM, Reading, Writing and Mathematics |
| Key Stage Two | Expected or Greater Depth and Greater Depth, each for Combined RWM, Reading, Writing, Mathematics and Grammar, Punctuation and Spelling |
Phonics End of KS1 is the share of year 2 pupils who met the expected standard in year 1 or year 2.
Read the figures
Section titled “Read the figures”The figures are percentages, apart from the MTC averages, which are scores out of 25. Under most of them, an arrow and a number show the change since your school’s previous academic year:
| What you see | Meaning |
|---|---|
| ▲ 21.7 green, up arrow | Higher than the previous year |
| ▼ 0.1 red, down arrow | Lower than the previous year |
| 0 | No change |
For a percentage, the change is in percentage points.
In the demo school’s results for the 2025 to 2026 academic year, Phonics Year One is 89.3% with a green ▲ 21.7. That is 21.7 percentage points higher than in 2024 to 2025. MTC Average Score is 20.8 with a red ▼ 0.1, a tenth of a mark lower. Phonics End of KS1 is 91.4% with 0, so it has not changed.
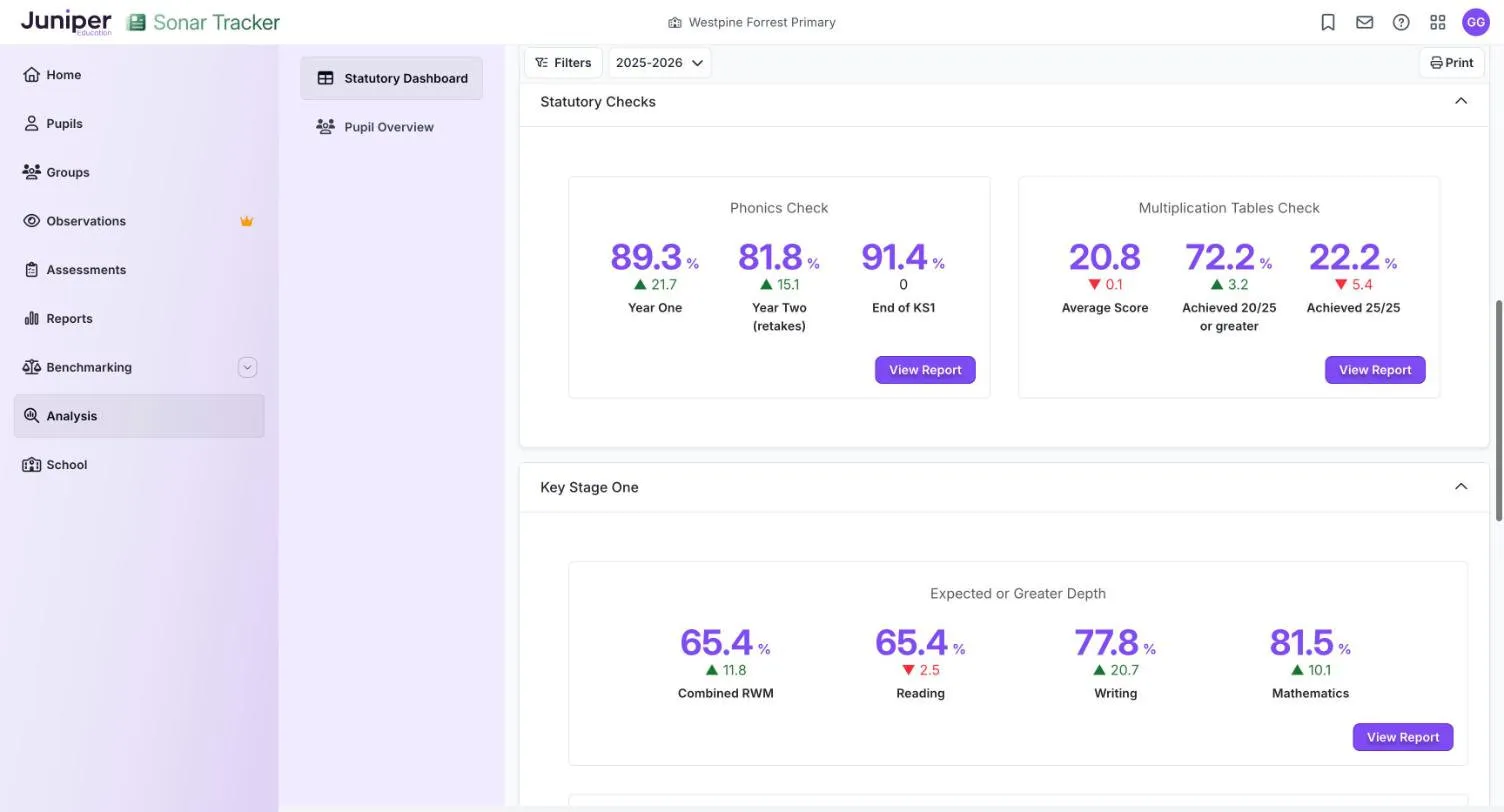
View Report
Section titled “View Report”View Report on a card opens charts for that measure, such as Key Stage Two - Expected or Greater Depth. The tabs split pupils by one characteristic at a time: By Pupil Premium (shown first), By Gender, By Disadvantaged and By SEN (special educational needs). Each subject has a bar chart with a dashed line for the School Average. Under each chart is a data table, such as Combined RWM Data Table.
For the demo school’s 2025 to 2026 KS2 results, By Pupil Premium shows 83.3% of pupil premium pupils at the expected standard in combined RWM. Other pupils are at 78.9%, and the School Average is 80. In groups this small, one pupil can move a figure by many percentage points, so check how many pupils are in each group.
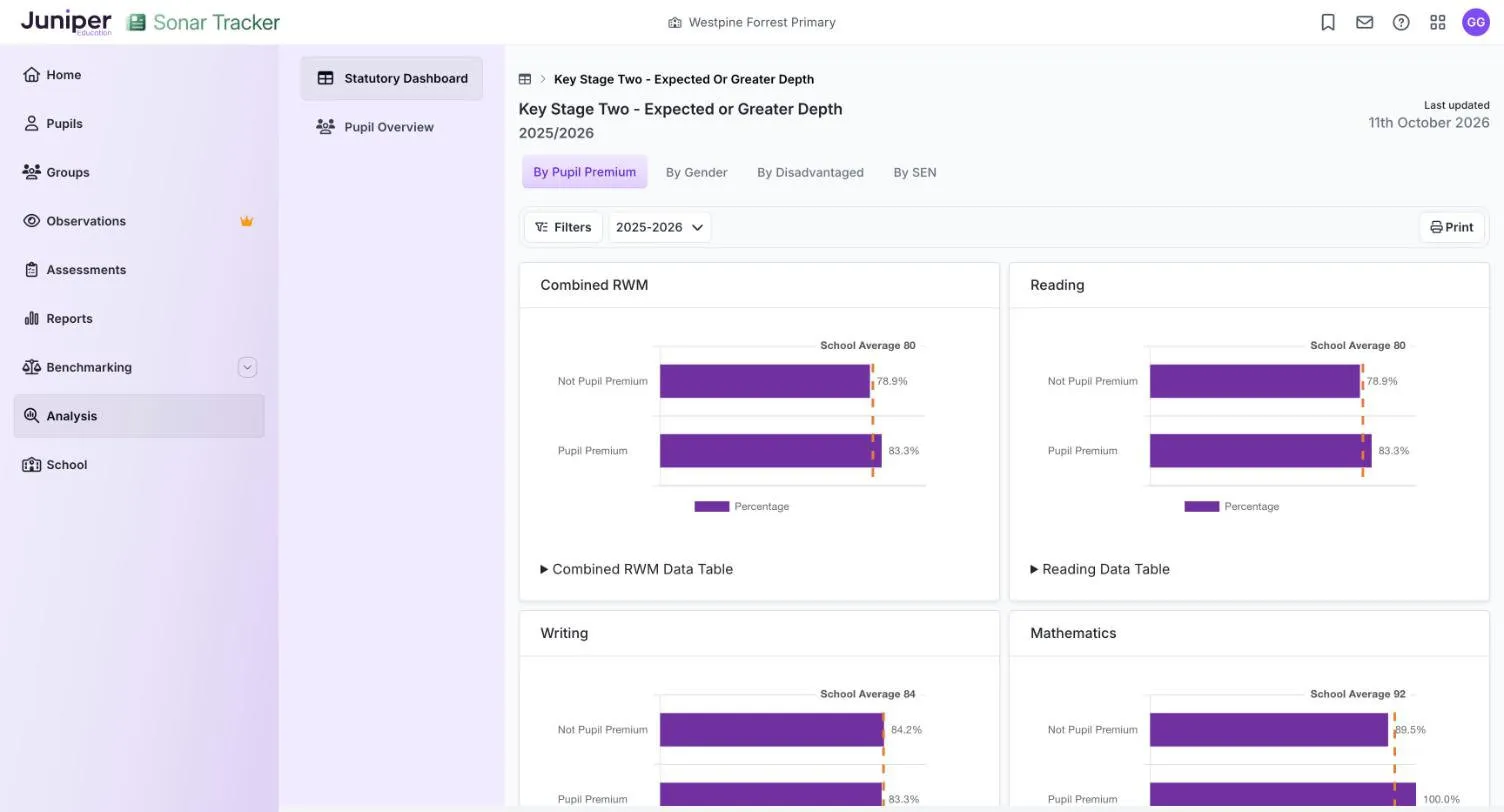
Each tab sets one group against the rest. You cannot compare one characteristic with another, such as pupils with SEN against pupils with English as an additional language.
Where the figures come from
Section titled “Where the figures come from”The dashboard reads the results on the statutory pages, whether they were entered in Sonar or imported. It refreshes overnight, so a result you enter today appears tomorrow. Last updated at the top gives the date of the latest refresh, 11th October 2026 in the demo.
Each measure counts eligible pupils: pupils in the right year group with the results that measure needs. Leavers are left out of most measures. The rules for each section are on Statutory Dashboard and Pupil Overview and apply to a single school too.
Points to watch
Section titled “Points to watch”Each percentage is a share of the eligible pupils, not of the whole year group. The statutory outcome reports can therefore give different percentages for the same cohort.
The EYFS figures count only children with a result in all 17 early learning goals. A child with any goal missing is left out, and a cohort with no complete results shows a dash, as in the demo school.
The MTC has no pass mark. Achieved 20/25 or greater is Sonar’s own measure, not a DfE one.
On the KS2 cards, Greater Depth in reading, maths and grammar, punctuation and spelling means the higher standard: a scaled score of 110 or more. Strictly, greater depth is a writing judgement.
KS1 assessment has been optional since the 2023 to 2024 academic year, so expect no KS1 figures for cohorts your school did not assess.