


 Sisra Analytics
Getting started
Get started as a senior leader or governor
Use this page to find whole-school information in Sonar Tracker and to read it with care, especially for small groups of pupils. Work through it with Sonar open.
Before you start
Section titled “Before you start”You need a Sonar account, which your school’s Account Owner or Account Admin sets up. Senior leaders who enter or correct data usually have Full Edit, and those who only look at data have Full Read-only. Governors have Minimal Read-only (see Set up governor accounts).
Most of these reports depend on complete data. Before a meeting, check with your assessment lead that judgements for the assessment point are in.
Find the reports for a meeting
Section titled “Find the reports for a meeting”- Go to Reports.
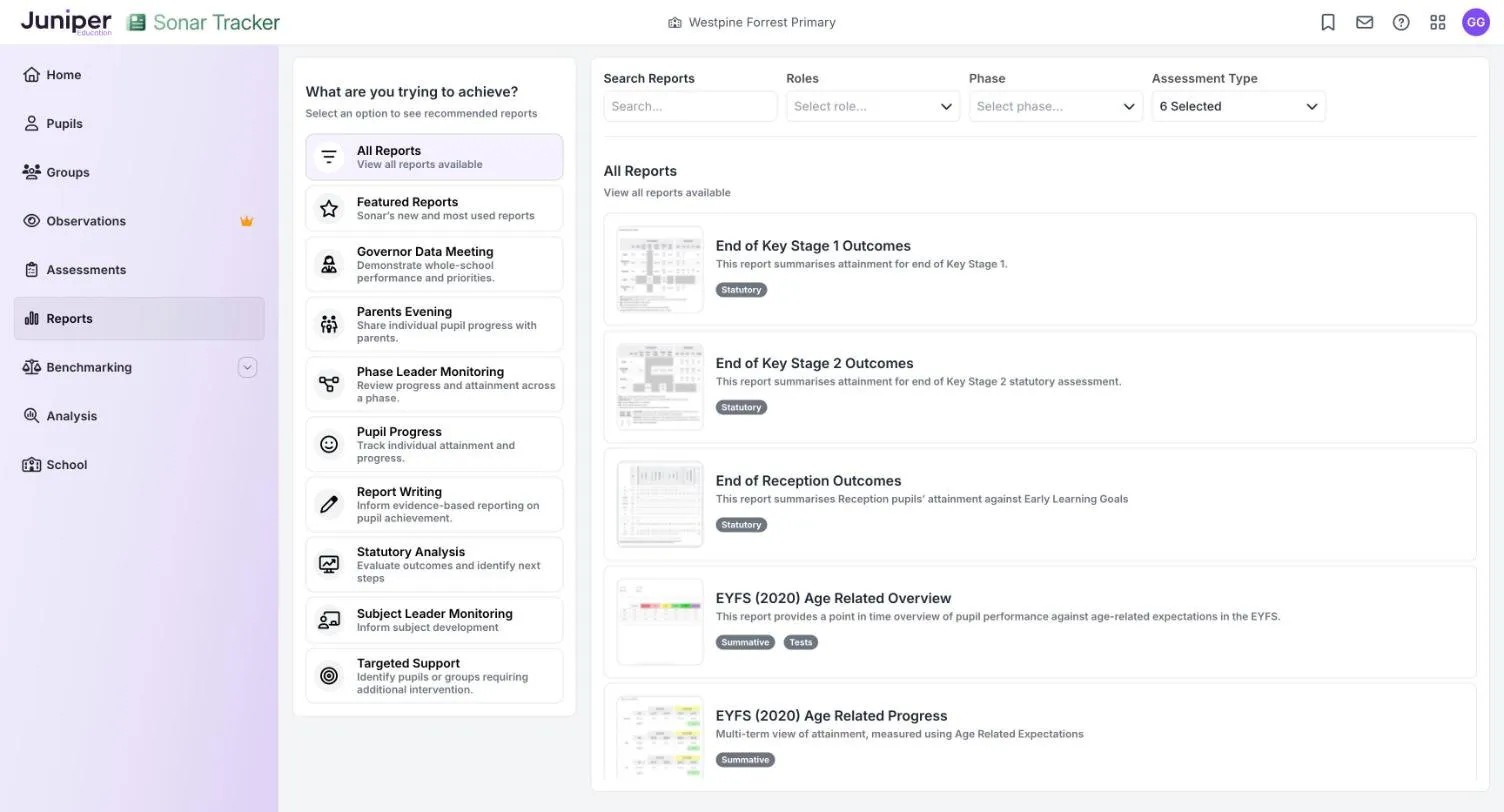
- Under What are you trying to achieve?, select Governor Data Meeting.
Sonar lists the reports it suggests for discussing whole-school performance and priorities. They include the Primary Age Related Overview, the Primary Characteristic Attainment Overview, the Primary Flight Path and the outcome reports for reception, KS1 and KS2. To narrow the list, choose Senior Leadership Team or Governor from the Roles filter.
Look at statutory results
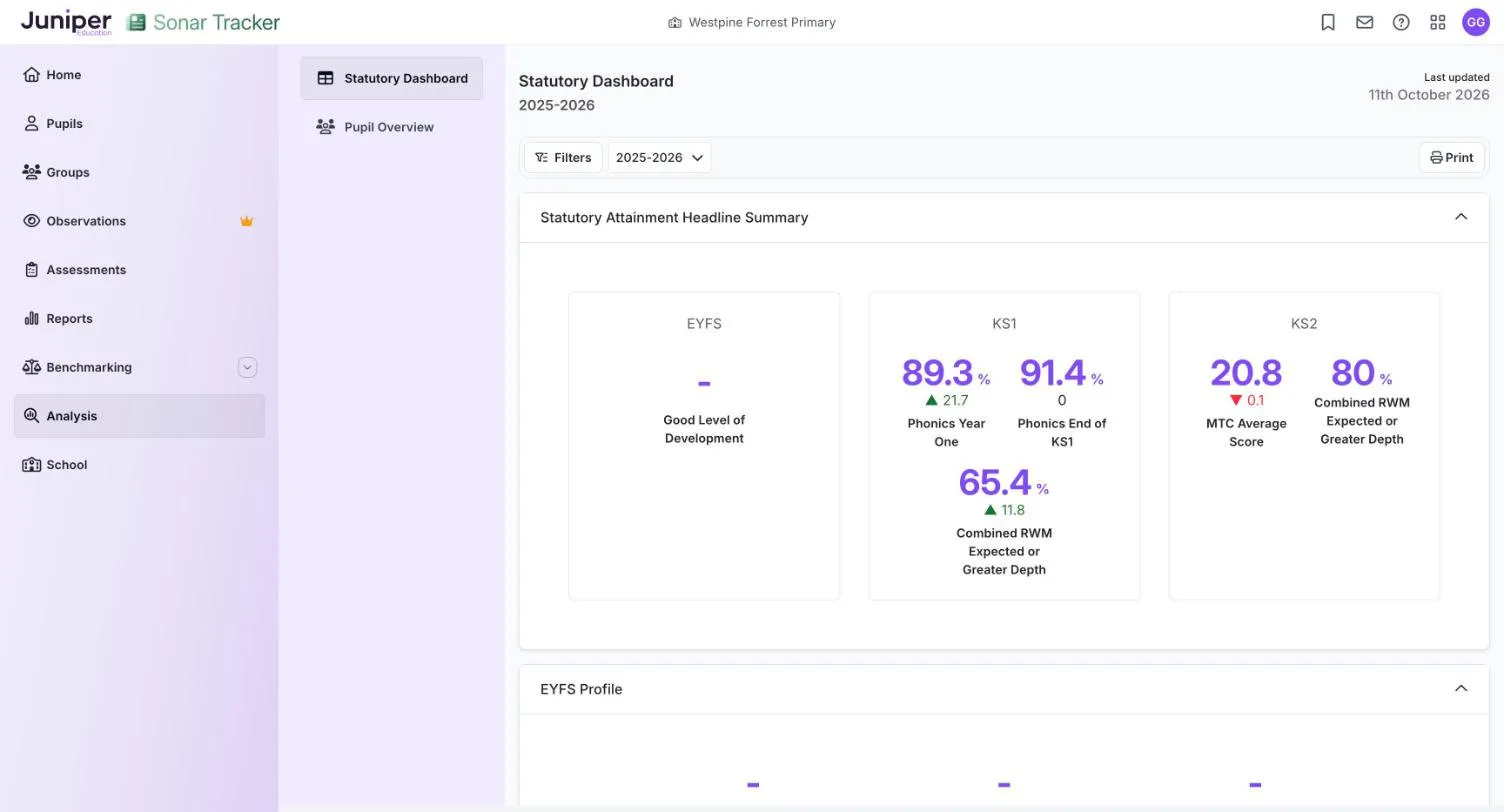
Section titled “Look at statutory results”- Go to Analysis, then select Statutory Dashboard.
- Choose the academic year from the year list.
The dashboard opens with a headline summary for EYFS, KS1 and KS2. It includes the percentage of pupils reaching a good level of development (GLD), phonics results and the multiplication tables check (MTC) average score. The sections below it give more detail on each assessment.
A green upward arrow shows a rise on the previous year, and a red downward arrow a fall. Figures refresh overnight, and Last updated gives the date. Select View Report in a section to see the figures behind it, or Print for a copy.
Pupil Overview, also under Analysis, shows pupil numbers and attendance by year group, gender, disadvantage and special educational needs (SEN). Statutory Dashboard and Pupil Overview explain each figure.
Look at teacher assessment across the school
Section titled “Look at teacher assessment across the school”These reports use teachers’ judgements, so they show where pupils are now. A judgement such as Securely At is a teacher’s in-year view, not a statutory outcome.
| Report | What it shows |
|---|---|
| Primary Age Related Overview | The percentage of pupils at each judgement, by subject, at one assessment point |
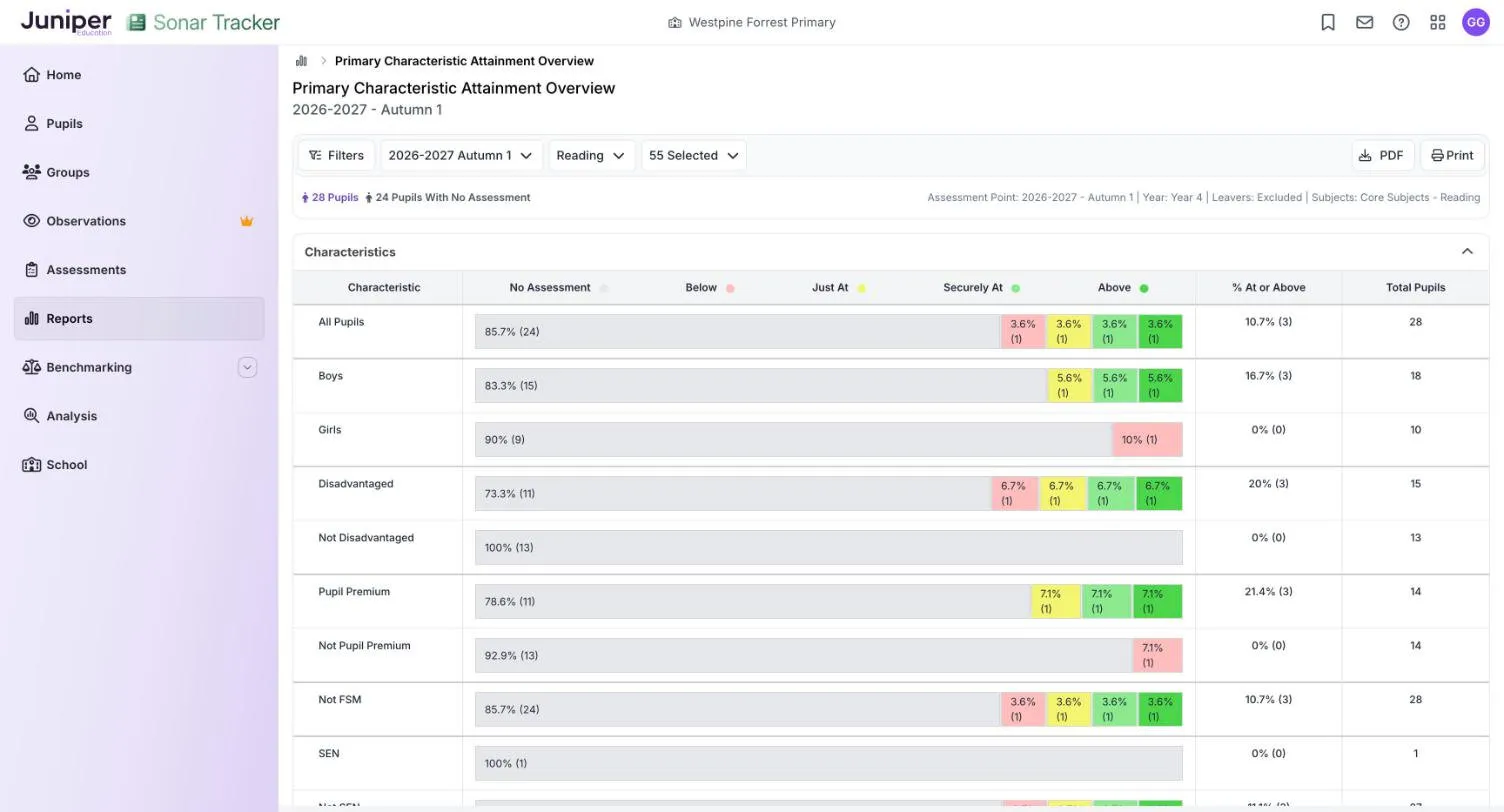
| Primary Characteristic Attainment Overview | Attainment for groups such as boys and girls, disadvantaged pupils, pupils with SEN and attendance bands |
| Primary Flight Path | Each pupil’s results in one subject from reception onwards, with summary rows for the year group |
| Benchmarking, if your school subscribes | Your school’s judgements beside the average for other schools that use Sonar |
Attainment reports, Pupil and class reports and Benchmarking explain each one.
In Benchmarking, National is the average for schools that use Sonar, not the DfE’s national figures, and LA is the average for Sonar schools in your local authority. Benchmarking runs only at autumn 2, spring 2 and summer 2. Teacher judgements are not moderated across schools, so treat a difference as a question to explore, not a verdict.
Read small groups with care
Section titled “Read small groups with care”In a small group, one pupil can move a percentage a long way. In the screenshot, the SEN row is 1 pupil, so a single judgement would take it from 0% to 100% at or above.
When you present data:
- give the number of pupils with each percentage, such as 3 of 4 pupils (75%)
- check how many pupils have no assessment before you read any percentage, because reports treat them differently
- look at trends over several years, rather than at one assessment point
Most reports show the count beside the percentage, such as 75.0% (3). Report figures do not match explains how each report counts pupils with no judgement. The DfE’s ‘Making data work’ report gives a sense of scale. In a one-form-entry primary, a gap between two groups may need to be about 40 percentage points before it is statistically meaningful.
Set up governor accounts
Section titled “Set up governor accounts”If governors look at data in Sonar, give each one their own account with the Minimal Read-only role. They can then view data but not change it, and pupil names are anonymised. Your Account Owner or Account Admin sets up accounts, as described in Governors.
‘Making data work’ recommends that governors do not routinely receive tracking data based on teacher judgement. Give the board summaries instead: statutory results, trends and the attainment of groups, without pupil names, in a format agreed in advance.
Inspection and internal data
Section titled “Inspection and internal data”Ofsted’s school inspection toolkit, in use from September 2026, says inspectors will not review internal data. They may ask how leaders use assessment information and what they did as a result. You do not need to produce reports from Sonar for an inspection. Check Ofsted’s website for any later changes.