


 Sisra Analytics
Reports
Statutory outcome reports
These three reports summarise a cohort’s statutory results: the EYFS profile, and the KS1 and KS2 assessments. They read the results entered or imported on the statutory pages (see Statutory assessment in Sonar) and use Sonar’s older report screen.
Choose the year group the cohort is in now, not the one they were in when assessed: last year’s reception class is now Year 1. If some pupils have left, include leavers. The Statutory Dashboard has its own rules about which pupils count, so its percentages for the same cohort can differ from these reports’.
End of Reception Outcomes
Section titled “End of Reception Outcomes”End of Reception Outcomes gives a cohort’s EYFS profile results goal by goal, with the share reaching a good level of development (GLD). EYFS leads and governors use it once the profile is complete, and year 1 teachers use it at transition.
Options
Section titled “Options”The only option is Summary View, in Display Options, which starts ticked. There is no academic year or subject list, because the report shows the children’s profile results.
Read the report
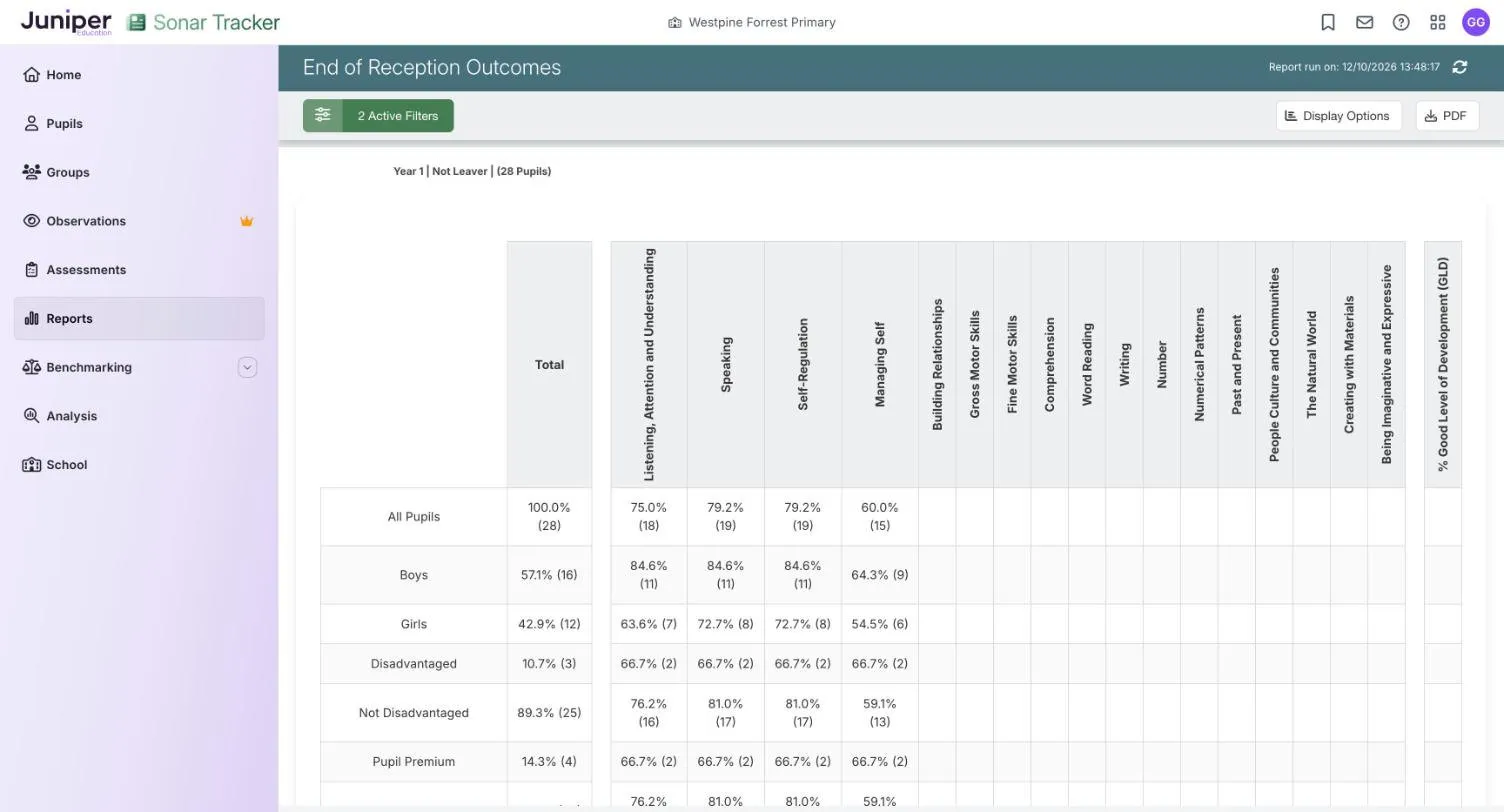
Section titled “Read the report”With Summary View ticked, each row is a group of children, such as All Pupils, Boys, Girls, Disadvantaged and Pupil Premium. Total gives the group’s size as a share of all the children. Each goal column gives the percentage and number of the group at the expected level. The last column, % Good Level of Development (GLD), gives the share reaching GLD.
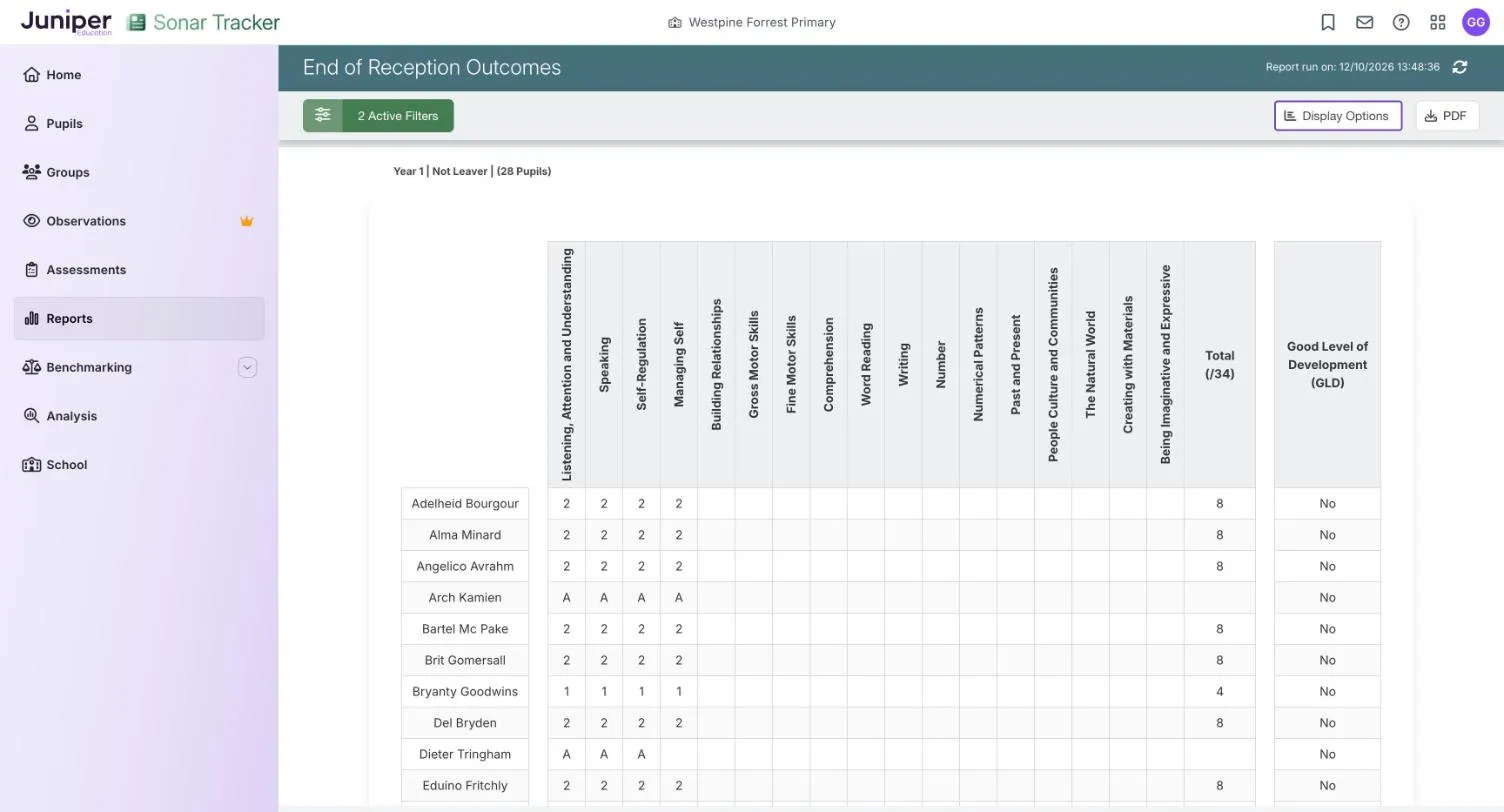
With Summary View unticked, each row is a child, and each goal shows the code from the profile:
| Code | Meaning |
|---|---|
| 2 | Expected |
| 1 | Emerging |
| A | Unable to assess, or exemption applies |
That is Sonar’s key. The Standards and Testing Agency (STA) allows A only for a child with an individual exemption on religious or philosophical grounds: see The codes.
After the goals come Total (/34) and Good Level of Development (GLD), which shows Yes or No for each child.
GLD means the expected level (2) in the 12 early learning goals (ELGs) for the prime areas, literacy and mathematics. The other five ELGs do not count. Total (/34) is a different measure. It adds 2 for each expected goal and 1 for each emerging goal across all 17. A child can reach GLD with a total below 34.
In the demo school, the current year 1 has 28 children and only four goals have results. In Listening, Attention and Understanding, 18 of the 24 children with a result (75.0%) reached the expected level. That is 11 of 13 boys and 7 of 11 girls. With most goals empty, every child shows No for GLD, and the % Good Level of Development (GLD) column is blank.
Points to watch
Section titled “Points to watch”Total and the goal columns use different bases. Total is the group’s share of all the children: boys are 57.1%, 16 of 28. Each goal column is a share of the group’s children with a result in that goal: 11 of 13 boys, not 11 of 16.
A child needs a result in every GLD goal before they can show Yes, so untick Summary View and look for blank cells.
Groups are small. In the demo, Disadvantaged is 3 children, so each child is worth 33.3 percentage points.
End of Key Stage 1 Outcomes
Section titled “End of Key Stage 1 Outcomes”End of Key Stage 1 Outcomes shows how a cohort’s KS1 teacher assessments and test scaled scores are spread in each subject. KS1 assessment has been optional since the 2023 to 2024 academic year, so the report only has data for cohorts your school chose to assess.
Options
Section titled “Options”| Option | What it does | Default |
|---|---|---|
| Academic year list | The year whose results are shown. Choose the year the cohort was in year 2. | The current academic year |
| Subject list, such as 4 Subjects | Reading, Writing TA / GPS Test, Mathematics and Science. With reading, writing and maths chosen, a Reading, Writing & Maths row is added. | All four |
| Display Options | Scaled Scores shows the test scaled score columns. Summary View adds rows for groups of pupils. Names lets you list the pupils behind a figure. | Scaled Scores ticked |
Writing TA / GPS Test pairs writing teacher assessment with the grammar, punctuation and spelling (GPS) test.
Read the report
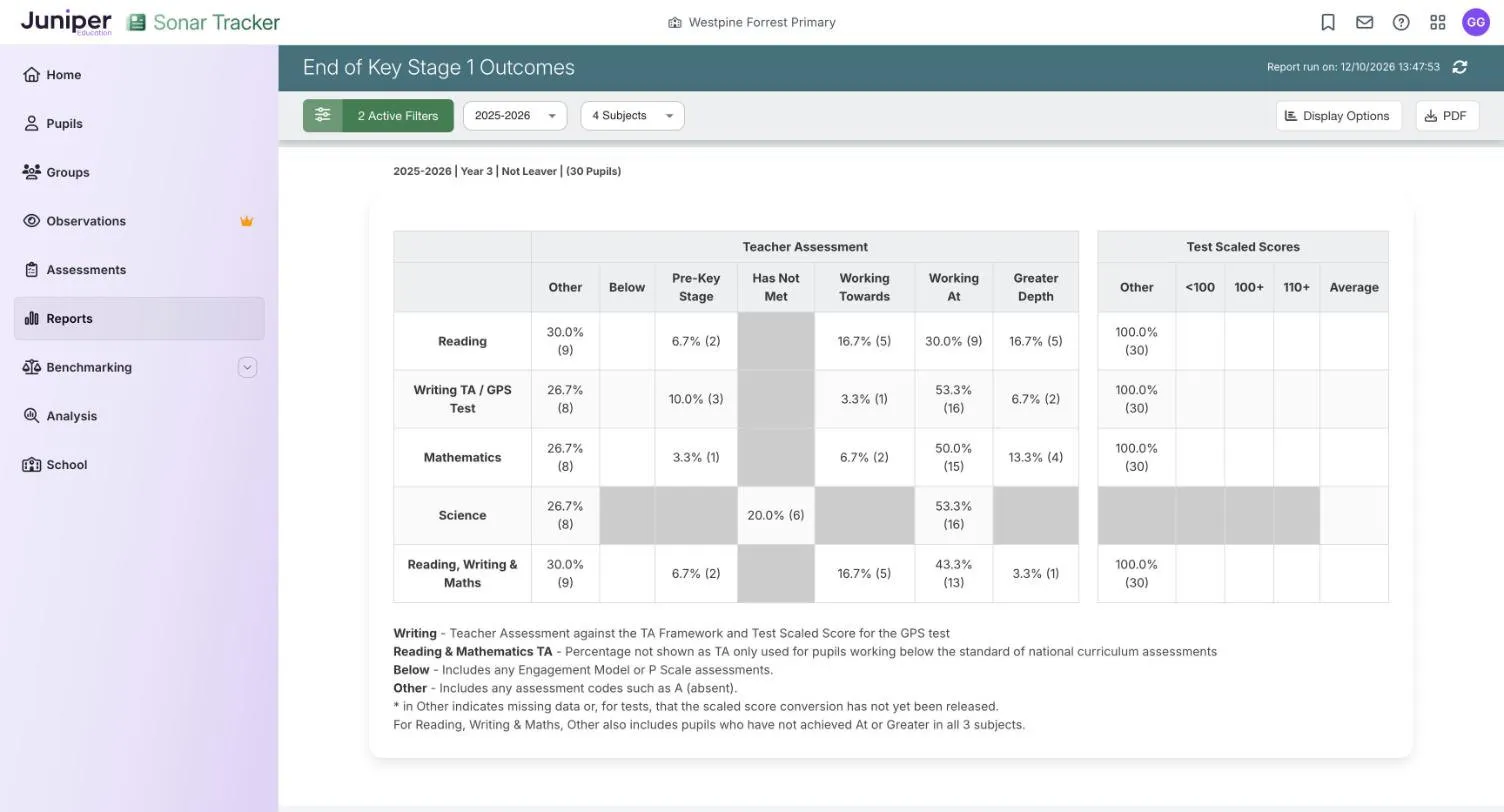
Section titled “Read the report”The table has a Teacher Assessment block and a Test Scaled Scores block. Grey cells do not apply to that subject: science teacher assessment, for example, has only Other, Has Not Met and Working At.
| Column | What it counts |
|---|---|
| Other | Pupils with no result, or with a code such as A (absent) |
| Below | Pupils assessed with the engagement model or P scales |
| Pre-Key Stage | Pupils working at the pre-key stage standards |
| Has Not Met | In science, pupils who have not met the expected standard |
| Working Towards | Working towards the expected standard (WTS) |
| Working At | Working at the expected standard (EXS) |
| Greater Depth | Working at greater depth (GDS) |
| <100, 100+, 110+ | Pupils with a scaled score below 100, of 100 or more, and of 110 or more |
| Average | The average scaled score |
The demo school’s current year 3 were in year 2 in the 2025 to 2026 academic year. In Reading, 9 of the 30 pupils (30.0%) were Working At and 5 (16.7%) Greater Depth, so 14 (46.7%) reached the expected standard or above. Another 9 (30.0%) are under Other. All 30 are under Other for test scaled scores, because no KS1 test results are recorded.
Points to watch
Section titled “Points to watch”Every percentage is a share of all the pupils selected, including those under Other, and the cells are not cumulative. Add Working At and Greater Depth for the share at the expected standard or above.
The notes under the table are the KS2 ones. The note that reading and maths teacher assessment percentages are not shown applies to KS2 only.
End of Key Stage 2 Outcomes
Section titled “End of Key Stage 2 Outcomes”End of Key Stage 2 Outcomes does the same for KS2 and adds the combined expected and higher standards. Leaders and governors use it once results come back in July.
Options
Section titled “Options”| Option | What it does | Default |
|---|---|---|
| Academic year list | The year whose results are shown | The current academic year |
| Subject list, such as 4 Subjects | Reading, Writing TA / GPS Test, Mathematics and Science | All four |
| Display Options | Summary View adds rows for groups of pupils. Names lets you list the pupils behind a figure. | Both unticked |
Read the report
Section titled “Read the report”The blocks and columns match the KS1 report. Reading and maths teacher assessment is only used for pupils working below the standard of the tests. Those rows show a count under Other, not a percentage.
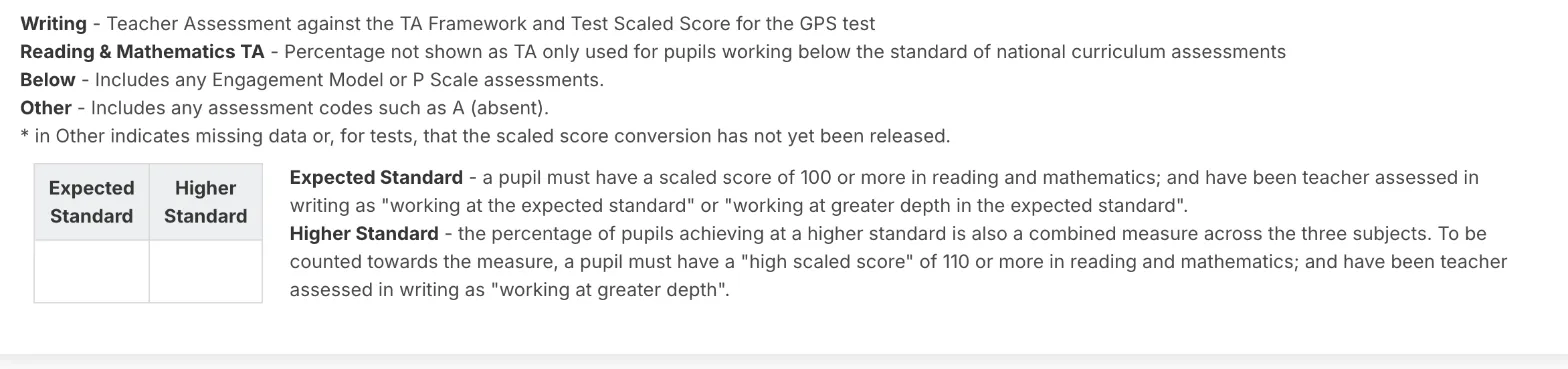
The notes under the table define the combined measures, shown in the Expected Standard and Higher Standard boxes:
- expected standard: a scaled score of 100 or more in reading and maths, and EXS or GDS in writing
- higher standard: a scaled score of 110 or more in reading and maths, and GDS in writing
An asterisk (*) under Other means missing data, or that the scaled score conversion has not been released. Scaled scores run from 80 to 120: see Understanding scaled scores at key stage 2 on GOV.UK.
Last year’s KS2 results belong to pupils who have now left. To see the demo school’s 2025 to 2026 results, choose Year 7, include leavers and choose 2025-2026. Year 6 with 2025-2026 shows this year’s year 6 instead, who had no KS2 results then, so every pupil appears under Other.
The results come from End of Key Stage Two, entered by hand or imported: see Key stage 2.
Points to watch
Section titled “Points to watch”Every percentage is a share of all the pupils selected, including those under Other.
The Statutory Dashboard may show KS2 results for a year while this report puts every pupil under Other. If so, check the year group, the leavers setting and the academic year. If all three are right, contact Juniper support.