


 Sisra Analytics
Reports
Progress reports
These reports compare pupils’ judgements or test scores at two or more assessment points. Keeping the same judgement from one point to the next is expected progress, and moving up is more than expected (Expected progress). Two reports share a name: Summative Progress Analysis (ARE) compares categories of age-related expectations (ARE), and Summative Progress Analysis counts codes.
Each report opens for the year group or class you choose, with leavers excluded. Filters, Display Options and PDF work as described in Find and run reports. In every report, read the number of pupils before the percentage: in a group of 8, one pupil is 12.5 percentage points.
The examples use year 4 in the demo school, from summer 2 of the 2025 to 2026 academic year to autumn 1. All 28 pupils have writing and maths judgements at both points, but only 4 have a reading judgement at autumn 1.
Age Related Progress
Section titled “Age Related Progress”Age Related Progress tracks the share of pupils on track in each subject across two or more assessment points. Go to Reports, then select Primary Age Related Progress or EYFS (2020) Age Related Progress.
Options
Section titled “Options”| Option | What it does | Default |
|---|---|---|
| Periods | The assessment points to compare. Tick two or more. | The last point of the previous academic year and the current point (2 Periods) |
| Subjects | The subjects to show | Reading, Writing and Mathematics (EYFS: Word Reading, Writing and Number) |
| Display Options | Summary View, Names, Combined and Not On Track | All unticked |
Read the report
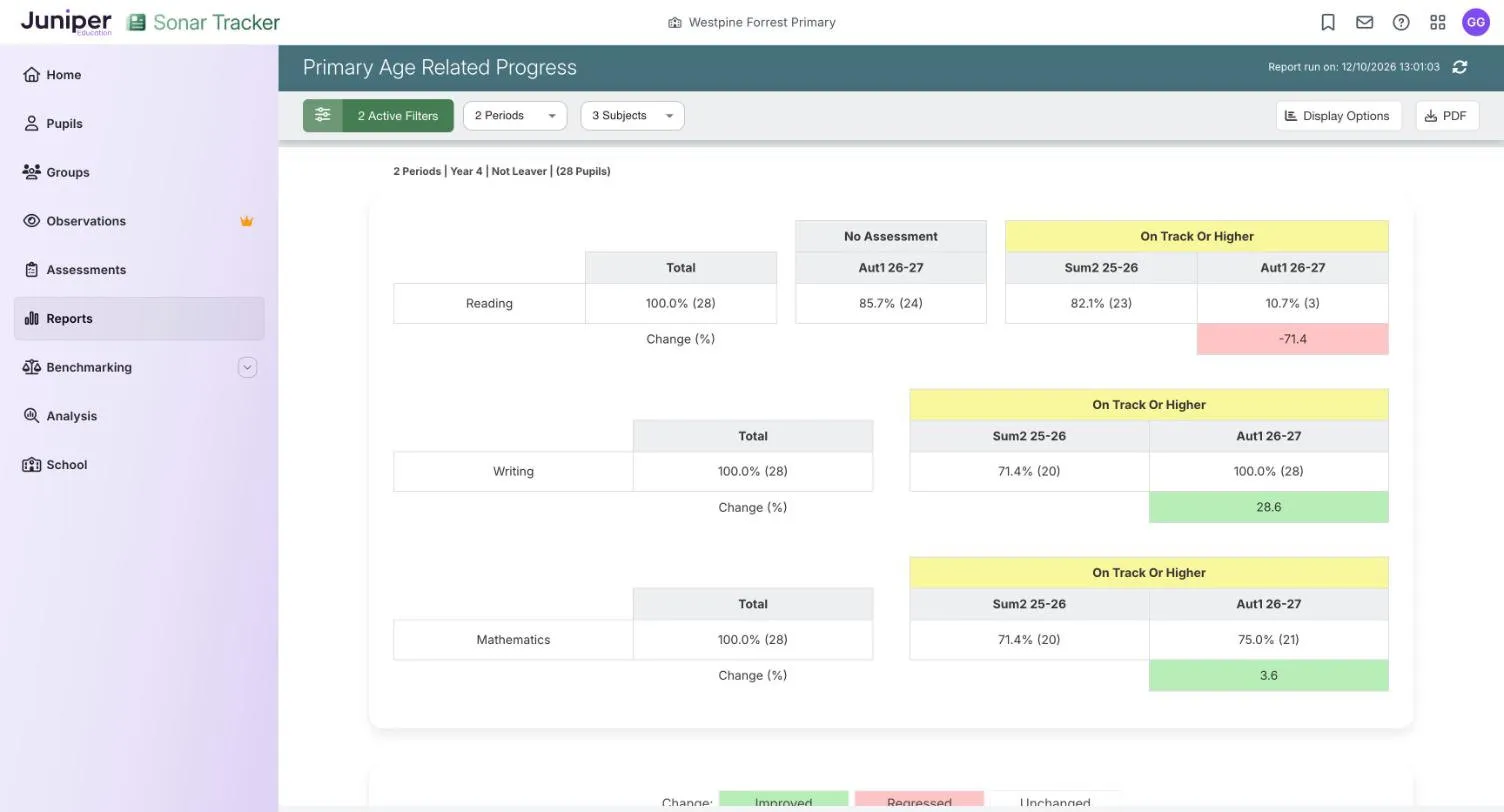
Section titled “Read the report”Each subject has its own block, where Total is every pupil in the report, such as 100.0% (28). On Track Or Higher is the share judged Just At or higher at each point. Points have short labels, such as Sum2 25-26 and Aut1 26-27. A No Assessment column appears for any point where pupils have no judgement. Change (%) is the difference between the points.
| Change cell | Meaning |
|---|---|
| Improved green | A higher share on track than at the earlier point |
| Regressed red | A lower share on track |
| Unchanged white | No change |
The yellow band above On Track Or Higher is a heading. It does not mean Just At.
In the example, writing rose from 71.4% (20) to 100.0% (28), a change of 28.6. Reading fell from 82.1% (23) to 10.7% (3), a change of -71.4. No Assessment shows why: 24 pupils (85.7%) have no reading judgement at autumn 1.
Points to watch
Section titled “Points to watch”Every percentage uses all the pupils in the report, so a missing judgement counts against the share on track, as in reading. Check No Assessment before you read Change (%). Despite its name, the change is in percentage points: maths in the example went from 71.4% to 75.0%, which shows as 3.6.
The report counts the pupils in the year group or class now. A pupil who joined after the earlier point shows as No Assessment at that point.
A pupil who drops from Securely At to Just At is still on track, so the figure does not move. Summative Progress Analysis (ARE) shows changes like this pupil by pupil.
Assessment Conversion Matrix
Section titled “Assessment Conversion Matrix”The Assessment Conversion Matrix groups pupils by an earlier outcome and shows where each group is now. It is designed to compare a statutory or earlier outcome, such as the early learning goals or key stage 1 teacher assessment, with a current judgement. In Reports, select Primary Assessment Conversion Matrix or EYFS (2020) Assessment Conversion Matrix.
Options
Section titled “Options”| Option | What it does | Default |
|---|---|---|
| From: | The earlier data set and point. The primary version offers Summative, ELGs 2020, End of Key Stage 1 TA or Test, and End of Key Stage 2 TA or Test. The EYFS version offers Summative only. | Summative, at the last point of the previous academic year |
| To: | The later data set and point, such as Summative or Targets | Summative, at the current point |
| Subject | One subject | Reading (EYFS: Listening, Attention and Understanding) |
| Display Options | Names, Cumulative and KPIs (the headline tiles) | KPIs ticked |
Read the report
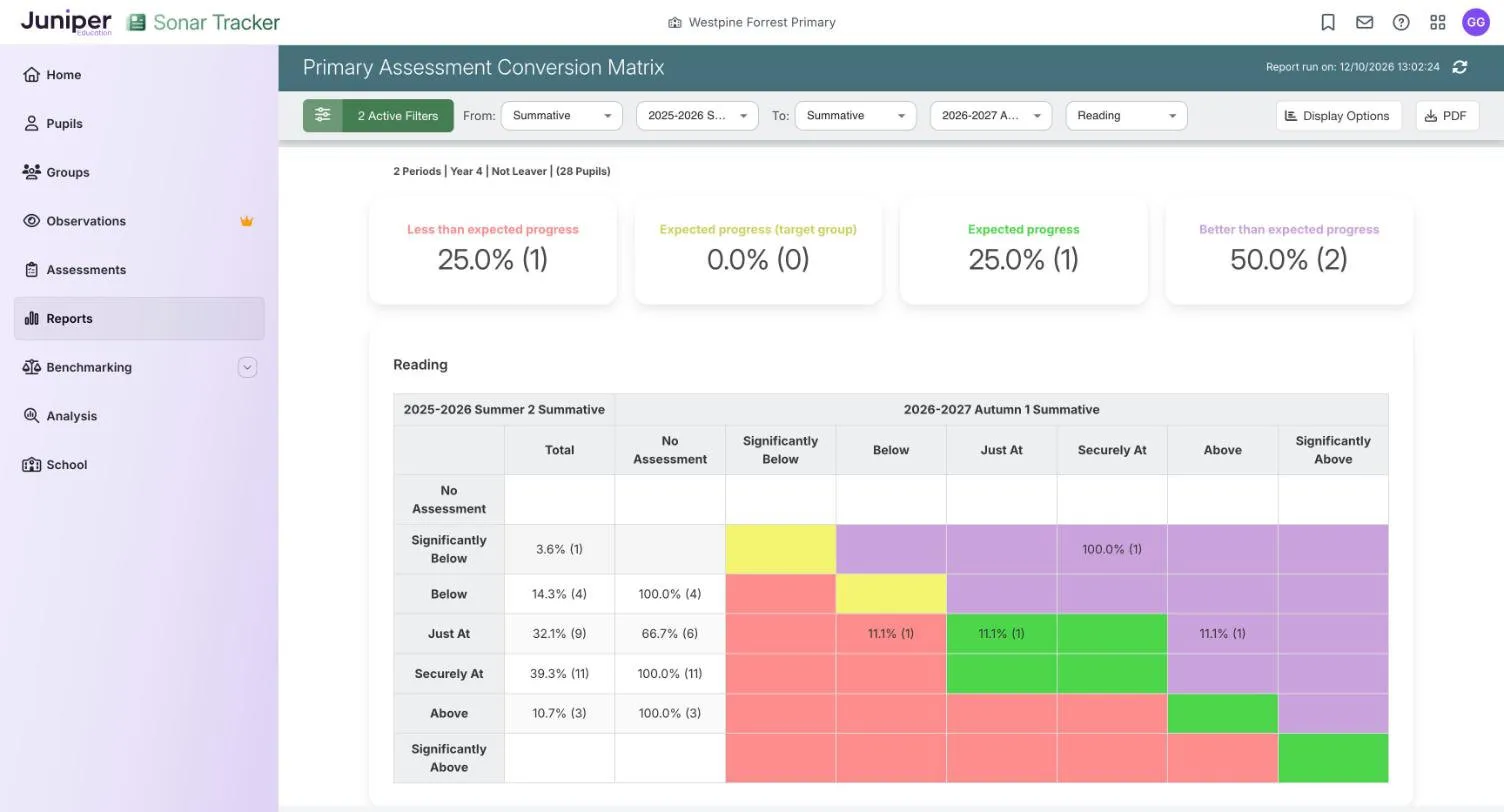
Section titled “Read the report”Four headline tiles give the share of pupils in each progress category, counting only pupils with an outcome at both points. Under them is the matrix. Each row is an outcome at the From point, under a heading such as 2025-2026 Summer 2 Summative. Each column is an outcome at the To point, including No Assessment. Total gives each row’s share of all pupils, and every other cell is a share of the pupils in its row.
| Colour | Meaning |
|---|---|
| Less than expected progress red | A lower outcome than expected from the earlier one |
| Expected progress (target group) yellow | Expected progress, but the pupil may benefit from extra support |
| Expected progress green | The outcome expected from the earlier one |
| Better than expected progress purple | A higher outcome than expected |
The example uses the default summative set-up, so read its numbers rather than its colours. In reading, 9 of the 28 pupils (32.1%) were Just At at summer 2. Of those 9, 6 (66.7%) have no autumn 1 judgement yet, and 1 each (11.1%) is now Below, Just At and Above. The tiles cover only the 4 pupils with a reading judgement at both points, so each pupil there is worth 25%.
Points to watch
Section titled “Points to watch”With summative judgements at both points, the colours do not follow Sonar’s rule for expected progress. The matrix treats Just At and Securely At alike. A drop from Securely At to Just At lands in a green cell, and so does a rise from Just At to Securely At. Sonar’s rule counts the first as less than expected and the second as more.
Small rows swing a long way. The Significantly Below row in the example is 1 pupil, so its one filled cell shows 100.0% (1).
End of Key Stage 1 TA and End of Key Stage 1 Test need key stage 1 results in Sonar. KS1 assessment has been optional since the 2023 to 2024 academic year. Pupils who joined from another school have no results until they are imported: see Import and export statutory data.
Quadrant
Section titled “Quadrant”Quadrant puts attainment and progress side by side and sorts the pupils into four groups for each subject. Use it to choose pupils to discuss at pupil progress meetings or for extra support. Go to Reports, then select Primary Quadrant or EYFS (2020) Quadrant.
Options
Section titled “Options”| Option | What it does | Default |
|---|---|---|
| From: | The earlier assessment point | The last point of the previous academic year |
| To: | The later point, the same as or after From | The current point |
| Subjects | One grid for each subject | Reading, Writing and Mathematics (EYFS: Word Reading, Writing and Number) |
| Display Options | Names lists the pupils in each quadrant, with both judgements | Unticked |
Read the report
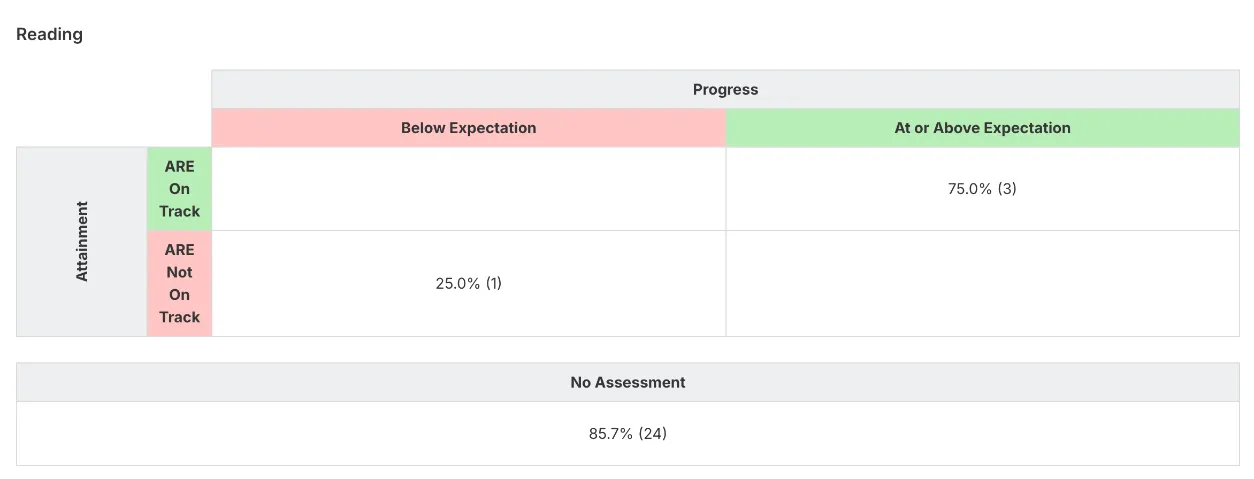
Section titled “Read the report”Each subject has a grid. The columns show progress between the two points: Below Expectation or At or Above Expectation. The rows show attainment at the To point: ARE On Track, meaning Just At or higher, or ARE Not On Track. A No Assessment box under the grid counts pupils missing a judgement at either point.
| Quadrant | Pupils in it |
|---|---|
| On track, at or above expectation | On track now, with the same or a higher judgement than before |
| On track, below expectation | Still on track, but lower than before, for example Above to Securely At |
| Not on track, at or above expectation | Below expectations, but with the same or a higher judgement, for example Below at both points |
| Not on track, below expectation | Below expectations, and lower than before |
Only the headings are coloured: ARE On Track and At or Above Expectation are green, ARE Not On Track and Below Expectation pink. The cells are white.
Year 4’s reading has 3 pupils (75.0%) on track and at or above expectation, and 1 (25.0%) not on track and below expectation. No Assessment shows 85.7% (24). In maths, where every pupil has both judgements, 21 (75.0%) are on track and at or above expectation. The other 7 (25.0%) are not on track but at or above expectation.
Points to watch
Section titled “Points to watch”The quadrants are shares of the pupils with a judgement at both points, but No Assessment is a share of all pupils. Reading in the example adds up to 185.7%, and each of its 4 assessed pupils is worth 25%.
A pupil assessed in a lower band at both points counts as Significantly Below both times. Quadrant shows them at or above expectation, whatever they have learned. Look at these pupils separately, as described in Assess pupils working below their year group.
At or above expectation includes pupils who kept the same judgement. In the not on track row, that means pupils who stayed Below: they have kept pace with the curriculum but not caught up.
Summative Progress Analysis (ARE)
Section titled “Summative Progress Analysis (ARE)”Summative Progress Analysis (ARE) compares each pupil’s judgements at two assessment points. It sorts the change into below expected, expected and above expected progress by age-related expectation category. Use it whenever you compare summative judgements at two points. Select Primary Summative Progress Analysis (ARE) or EYFS (2020) Summative Progress Analysis (ARE) in Reports.
Until September 2026 these reports were called Summative Progress Analysis. That name now belongs to a different report.
Options
Section titled “Options”| Option | What it does | Default |
|---|---|---|
| From:, To: | The two assessment points | The last point of the previous academic year, and the current point |
| Subjects | The subjects to show | Reading, Writing and Mathematics (EYFS: Word Reading, Writing and Number) |
| Display Options | Summary View, Names, Combined, KPIs, Overview Table, Chart and Pupil Table | KPIs, Overview Table, Chart and Pupil Table ticked |
Read the report
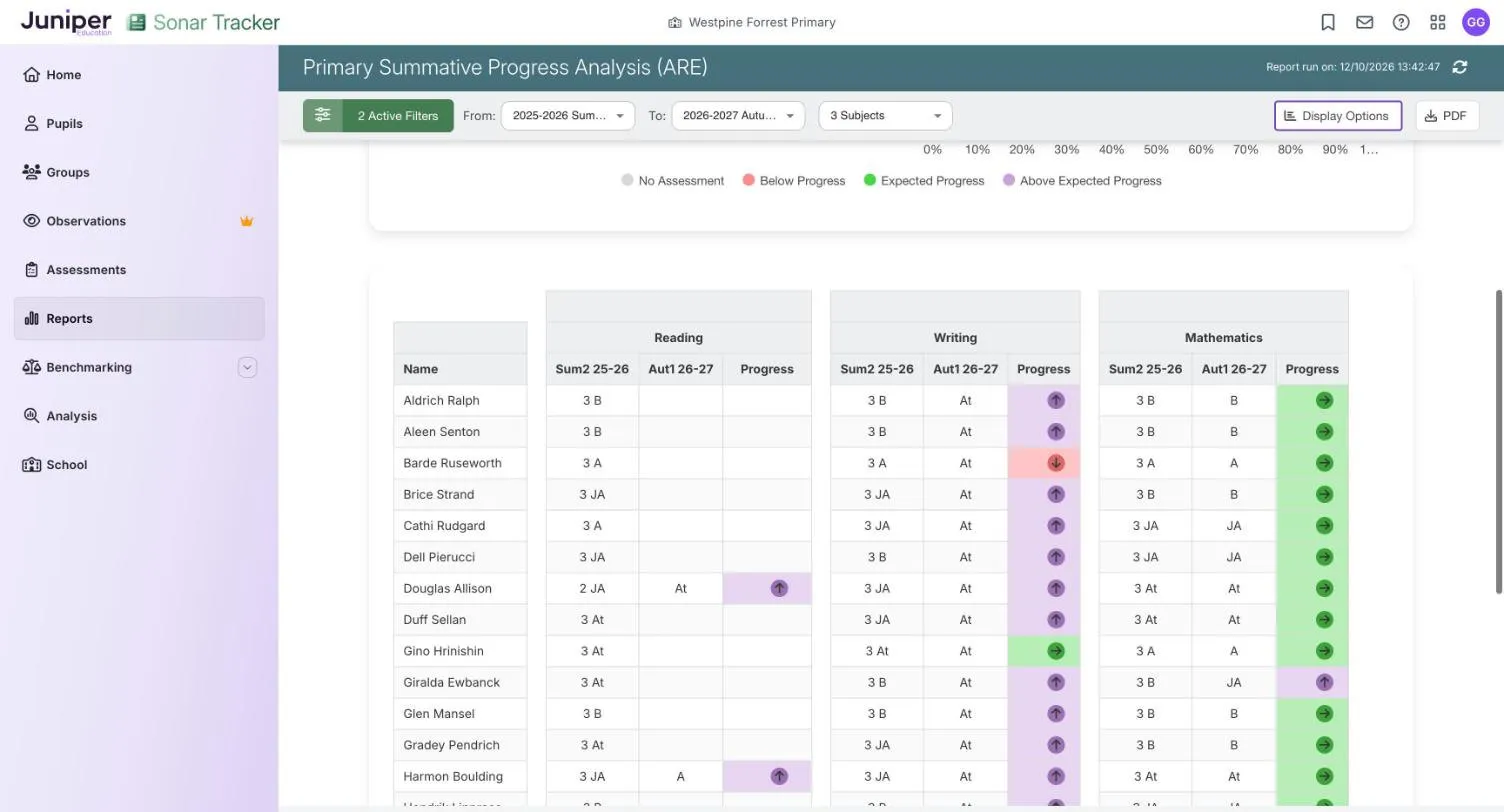
Section titled “Read the report”The tile Expected progress or higher in all subjects gives the share of pupils who made at least expected progress in every subject shown. The table and chart give each subject’s split between the progress categories. The Pupil Table lists each pupil’s judgement at both points, with an arrow for their progress.
| Colour | Meaning |
|---|---|
| No Assessment grey | No judgement at one or both points |
| Below Progress red, down arrow | A lower category than at the From point |
| Expected Progress green, right arrow | The same category |
| Above Expected Progress purple, up arrow | A higher category |
Earlier judgements show their band, such as 3 JA for Just At in Band 3. Going from 3 JA in year 3 to JA in year 4 keeps the same category, so it is expected progress.
In the example’s writing, 1 pupil (3.6%) made below expected progress, 8 (28.6%) expected and 19 (67.9%) above expected. In the Pupil Table, Barde Ruseworth’s 3 A to At has a red down arrow. Gino Hrinishin’s 3 At to At is green, and Aldrich Ralph’s 3 B to At has a purple up arrow.
Points to watch
Section titled “Points to watch”The progress columns are shares of the pupils with a judgement at both points, but No Assessment is a share of all pupils. In the example’s reading, No Assessment shows 85.7% (24). The progress columns show 25.0%, 25.0% and 50.0% of the 4 pupils with both judgements: 185.7% in all. The tile also counts only pupils with both judgements in every subject shown, so its 75.0% (3) is 3 of 4 pupils.
A pupil judged in a lower band at both points stays Significantly Below, so this report shows expected progress whatever they have learned. Summative Progress Analysis shows the smaller steps these pupils make.
Summative Progress Analysis
Section titled “Summative Progress Analysis”Summative Progress Analysis counts how many codes each pupil has moved between two assessment points, regardless of age-related expectations. Because it shows small steps, it suits pupils working outside their year group’s band. In Reports it is Primary Summative Progress Analysis or EYFS (2020) Summative Progress Analysis, without (ARE) in the name. Before September 2026, that name meant the (ARE) report, so check which one a colleague or an older help article means.
Options
Section titled “Options”The options and defaults are the same as for Summative Progress Analysis (ARE).
Read the report
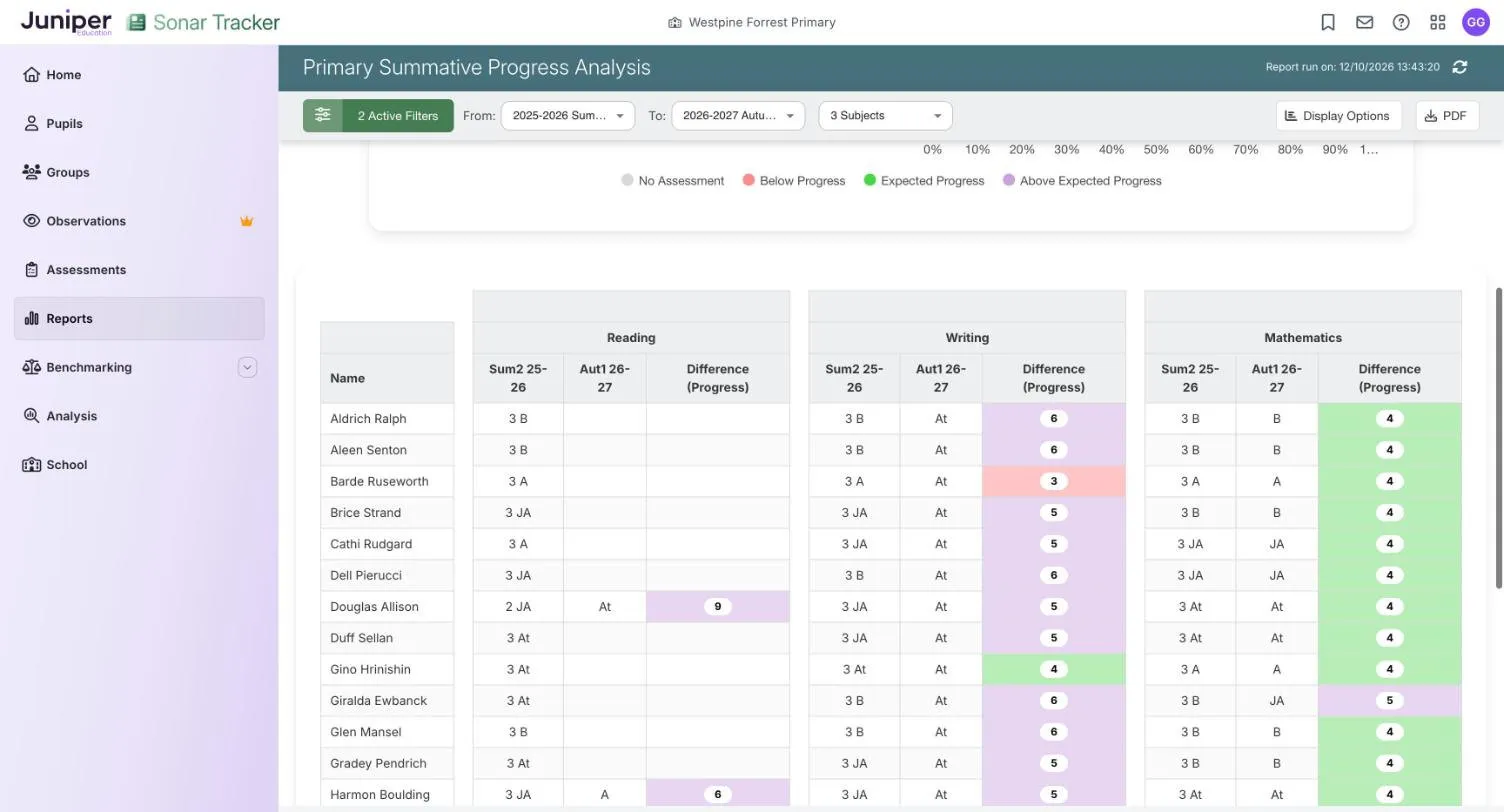
Section titled “Read the report”The tile, table, chart and colours match the (ARE) report, and in the demo school every headline figure is the same. The difference is the Difference (Progress) column in the Pupil Table: a number in a white badge on a coloured cell.
The number is how many codes the pupil has moved. Each band has four codes, B, JA, At and A, and each band follows on from the one below. Keeping the same judgement from one year’s band to the next is therefore 4 codes, and keeping it within one academic year is 0.
| Cell | Meaning |
|---|---|
| 3 red | Less than expected progress |
| 4 green | Expected progress, such as 4 codes from summer 2 to the next autumn 1 |
| 6 purple | More than expected progress |
In the example, Aldrich Ralph’s maths went from 3 B to B, which is 4 (green). His writing went from 3 B to At, which is 6 (purple). Barde Ruseworth’s writing went from 3 A to At, which is 3 (red). Douglas Allison’s reading went from 2 JA to At, which is 9 (purple): he has moved from the year 2 band into the year 4 band.
Points to watch
Section titled “Points to watch”The headline figures use the same bases as the (ARE) report, so a subject’s row can add up to more than 100%.
The number counts codes, not amounts of learning. Codes are not equal steps, so do not add the numbers up or average them.
A pupil who moves from 2 JA at autumn 2 to 2 At at summer 2 has moved 1 code. The (ARE) report shows the same pupil as making expected progress, because they are Significantly Below at both points.
Test Performance Progress
Section titled “Test Performance Progress”Test Performance Progress is Age Related Progress for test scores: it shows how the share of pupils on track has changed between assessment points. Select Test Performance Progress in Reports. There is no EYFS version.
Options
Section titled “Options”The options and defaults are the same as for Age Related Progress: Periods, Subjects and Display Options.
Read the report
Section titled “Read the report”The layout matches Age Related Progress, with Total, No Assessment, On Track Or Higher and Change (%) for each subject. Change cells are Improved green, Regressed red or Unchanged white. A pupil counts as on track when their score is in or above the Scores ARE band for their year group, subject and term. Not On Track adds the pupils below the band.
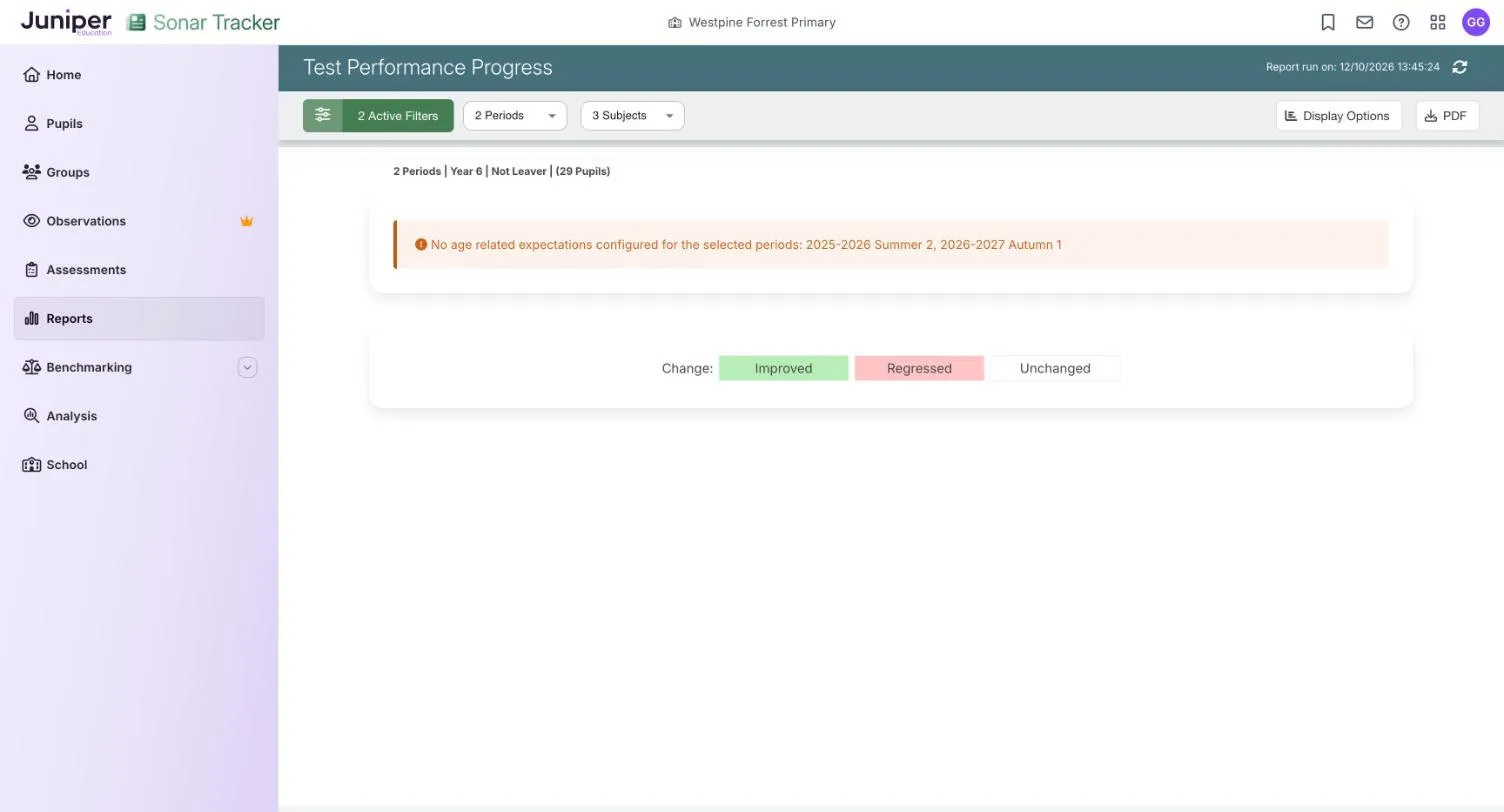
If no bands are set for the terms you choose, the report shows only an orange message and the key. In the demo school, year 6 shows “No age related expectations configured for the selected periods: 2025-2026 Summer 2, 2026-2027 Autumn 1”. An Account Owner or Account Admin needs to set bands for each subject, year group and term you compare. See Set the age-related expectation bands.
Points to watch
Section titled “Points to watch”Every percentage uses all the pupils in the report, so missing scores look like a fall.
The bands decide who counts as on track. If the bands for two terms are set on different bases, a change can come from the bands rather than the pupils.
A test score is one piece of evidence, with its own margin of error. Enter test scores explains standardised and scaled scores.