


 Sisra Analytics
Reports
Attainment reports
These reports show where pupils are at one assessment point, from teachers’ summative judgements against age-related expectations (ARE). For changes between points, see Progress reports. Each report opens for the year group or class you choose, with leavers excluded. Filters, Display Options and PDF work as described in Find and run reports.
The examples use year 4 in the demo school at autumn 1 of the 2026 to 2027 academic year. All 28 pupils have writing and maths judgements, but only 4 have a reading judgement so far. Reading therefore shows how each report handles missing judgements.
Age Related Overview
Section titled “Age Related Overview”Age Related Overview gives the share of pupils at each judgement in each subject at one assessment point. Go to Reports, then select Primary Age Related Overview or EYFS (2020) Age Related Overview.
Options
Section titled “Options”| Option | What it does | Default |
|---|---|---|
| Academic year and term | The assessment point to report on | The current point |
| Summative against ARE, Test scores against ARE | Teachers’ judgements, or test scores placed against your Scores ARE bands. Primary version only. | Summative against ARE |
| Subjects | The subjects in the table | Reading, Writing and Mathematics (EYFS: Word Reading, Writing and Number) |
| Display Options | Summary View, Names, Cumulative, Combined, Opportunities, Enable Modelling, KPIs, Overview Table and Chart | KPIs, Overview Table and Chart ticked |
Schools with educational ages switched on also see an option for ages. Opportunities and Enable Modelling appear only in this report: see Change what a report shows.
Read the report
Section titled “Read the report”Two headline tiles come first. Just At or higher in all subjects counts pupils on track in every subject shown. Above or higher in all subjects counts pupils on track for the higher standard in all of them.
The table has a row for each subject and a column for each judgement, with a percentage and, in brackets, the number of pupils. The chart shows the same figures, with No Assessment drawn to the left of 0%.
| Column | Meaning |
|---|---|
| No Assessment grey | No judgement at this assessment point |
| Significantly Below red | A judgement from a lower year group’s band |
| Below pink | Below expectations, in the pupil’s own band |
| Just At yellow | On track, but not yet securely |
| Securely At light green | Securely on track |
| Above green | On track for the higher standard |
| Significantly Above purple | A judgement from a higher year group’s band |
In the example, 26 of the 28 pupils are Securely At in writing (92.9%), and 1 each is Just At and Above (3.6%). Reading shows 85.7% (24) under No Assessment. Below, Just At, Securely At and Above each show 25.0% (1), one each of the 4 pupils assessed. The tile Just At or higher in all subjects shows 75.0% (3).
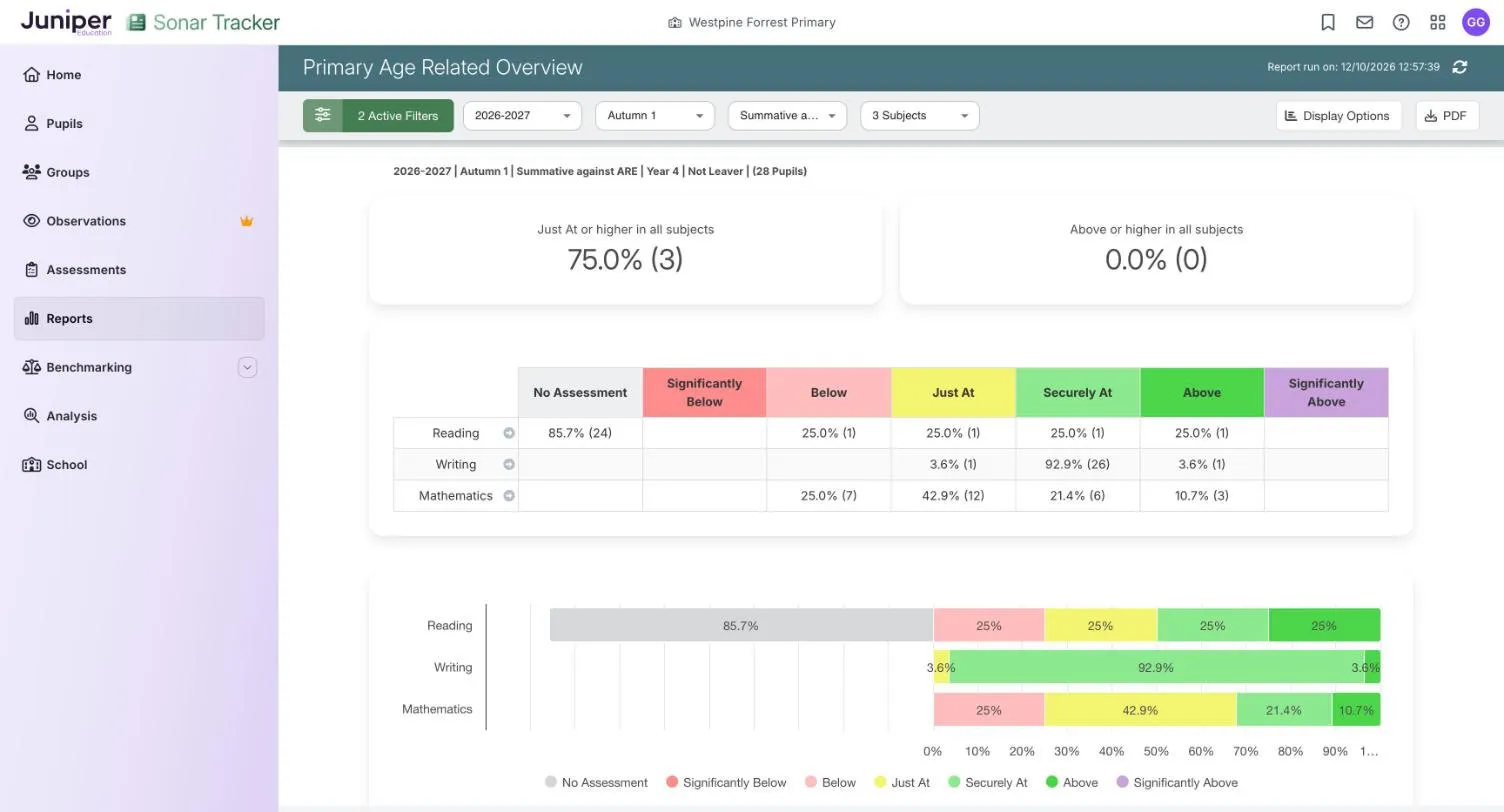
Select a figure to list the pupils behind it, or the arrow beside a subject to open its Subject Overview.
Points to watch
Section titled “Points to watch”No Assessment is a share of all pupils, but every other column is a share of the pupils with a judgement in that subject. A row can therefore add up to more than 100%: reading in the example comes to 185.7%. The tiles count only pupils with a judgement in every subject shown, so the 75.0% (3) is 3 of 4 pupils, not 3 of 28.
Sonar does not carry judgements forward, so No Assessment stays large until teachers have entered the new point. While few pupils are assessed, read the count before the percentage.
Significantly Below counts every judgement from a lower band, whatever the code, so it cannot show progress within that band. Test scores against ARE needs bands set on Scores ARE for the subject, year group and term: see Set the age-related expectation bands.
Venn shows who reaches a chosen judgement in one, two or all three subjects, such as pupils on track in reading, writing and maths together. Select Primary Venn in Reports, or EYFS (2020) Venn to compare up to three early learning goals.
Options
Section titled “Options”| Option | What it does | Default |
|---|---|---|
| Attainment, Targets | Teachers’ judgements, or the targets set for the chosen term | Attainment |
| Academic year and term | The assessment point | The current point |
| Subjects | Two or three subjects, with a circle for each | Reading, Writing and Mathematics |
| Threshold list | The lowest judgement that counts, from Significantly Below to Significantly Above. Each choice means that judgement or higher. | Just At |
| Display Options | Chart shows the diagram. Table lists the pupils in each region. | Both ticked |
Read the report
Section titled “Read the report”The chart’s title names the threshold, such as “Pupils ‘Just At’ or higher”. Each circle is a subject, and its colour only tells the subjects apart. Pupils in an overlap reach the threshold in each of those subjects, so the centre holds pupils who reach it in all three. Pupils outside of diagram reach it in none. Each region gives a percentage and the number of pupils.
The tables under the chart list the pupils in each region, with their judgements in the usual colours:
| Cell | Meaning |
|---|---|
| B pink | Below |
| JA yellow | Just At |
| At light green | Securely At |
| A green | Above |
| Blank | No judgement in that subject |
In the example, with the threshold at Just At, the centre shows 10.7% (3): 3 pupils are on track in reading, writing and maths. Writing and maths overlap at 64.3% (18), and writing alone holds 25.0% (7). The table explains the 7: each is Securely At in writing and Below in maths, with no reading judgement.
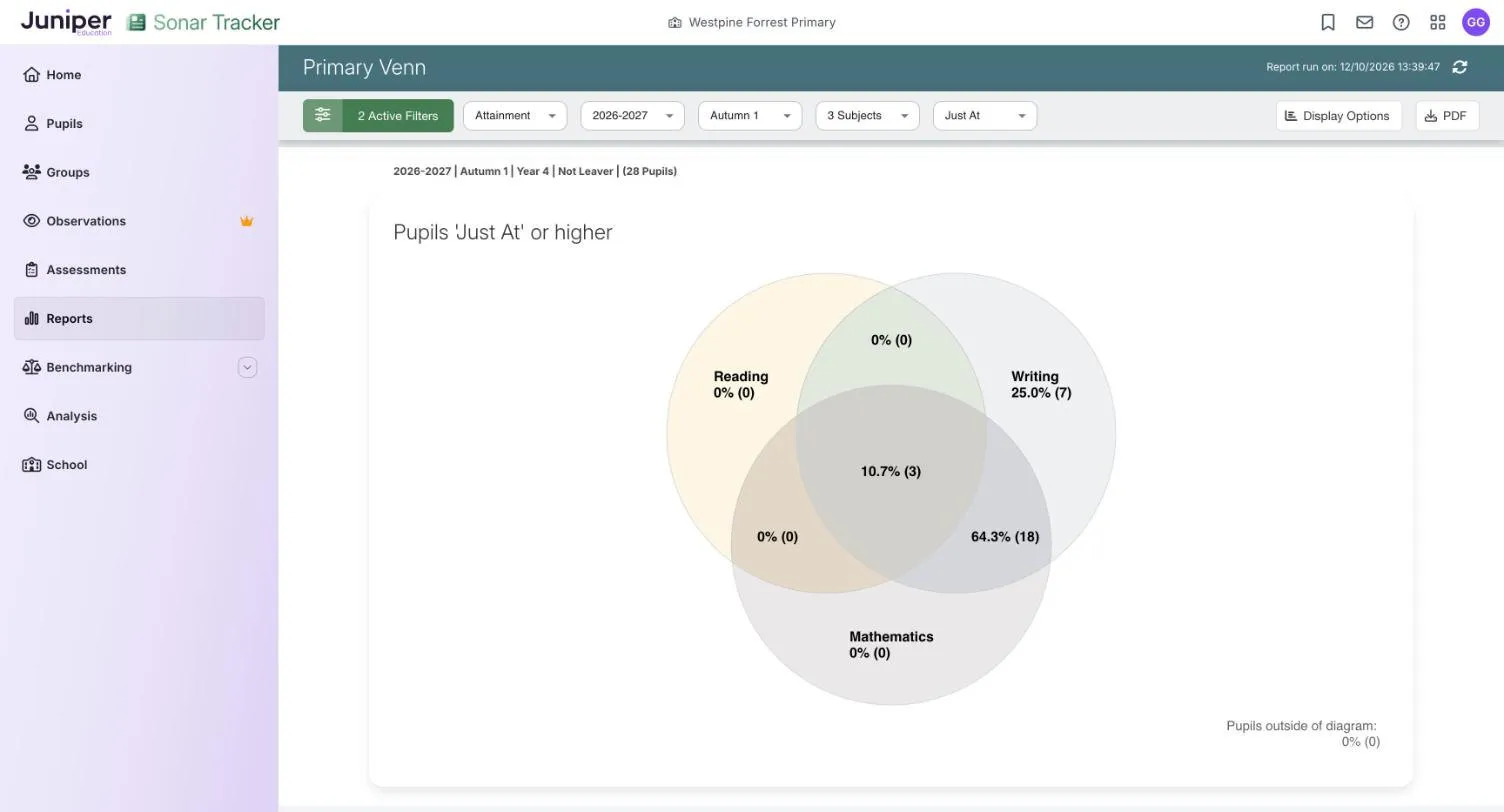
Points to watch
Section titled “Points to watch”Every percentage is a share of all the pupils in the report. A pupil with no judgement in a subject counts as missing the threshold there. The reading circle in the example is nearly empty because 24 pupils have no reading judgement yet, not because they are below.
With Securely At as the threshold, pupils who are Just At fall outside that subject’s circle although they are on track.
With any number of subjects other than two or three, the report shows a message instead of a diagram. Targets uses the targets entered for the term you choose, so if your school sets targets for summer 2 only, choose Summer 2.
Characteristic Attainment Overview
Section titled “Characteristic Attainment Overview”Characteristic Attainment Overview compares attainment in one subject across groups of pupils, such as boys and girls, disadvantaged pupils, ethnic groups and attendance bands. Find it in Reports as Primary Characteristic Attainment Overview or EYFS Characteristic Attainment Overview. It is a newer report, so it has a Filters panel, Print and pupil counts instead of Display Options.
Options
Section titled “Options”| Option | What it does | Default |
|---|---|---|
| Assessment point | The point to report on | The current point |
| Subject | One subject, or one early learning goal in the EYFS version | Reading (EYFS: Listening, Attention and Understanding) |
| Characteristics list | The groups shown as rows: Gender, Disadvantaged, FSM, Pupil Premium, SEN, EAL, Ethnicity, Attendance Band, Summer born and Leaver. Expand a group to choose its rows. | All ticked |
Read the report
Section titled “Read the report”Each group has a row, starting with All Pupils, and ethnic groups and attendance bands follow the main characteristics. Most rows come in pairs, such as Boys and Girls.
| Column | What it shows |
|---|---|
| Bar | The group split by judgement, with a percentage and number in each part |
| % At or Above | Pupils who are Just At or higher, as a share of the group |
| Total Pupils | The number of pupils in the group |
The bar’s heading is its key. It lists only the judgements that appear, in the colours shown for Age Related Overview.
For reading in the example, All Pupils shows 10.7% (3) at or above: 3 of all 28 pupils. Boys shows 16.7% (3) of 18 and Girls 0% (0) of 10. Disadvantaged shows 20% (3) of 15, and the SEN row is a single pupil.
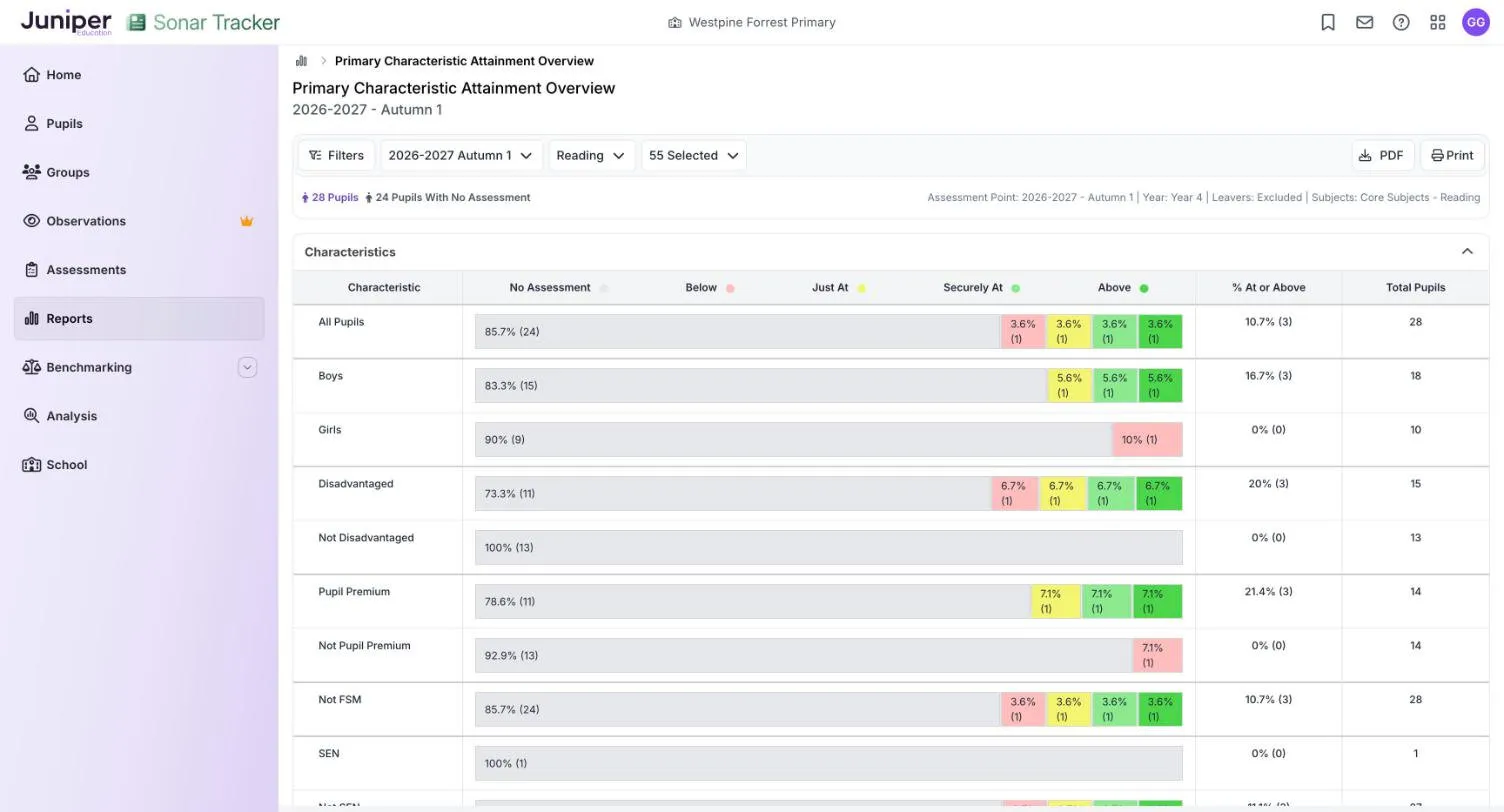
Select a row to see the pupils in each part of its bar.
Points to watch
Section titled “Points to watch”Every percentage here is a share of the whole group, pupils with no judgement included. Age Related Overview leaves them out of every column except No Assessment. In the example, each assessed pupil is 3.6% (1) here but 25.0% (1) there. % At or Above includes Just At.
Small rows appear without any warning. In the demo school’s EYFS version, several ethnic groups are a single child, so one judgement moves the row between 0% and 100%. Check Total Pupils before you compare groups.
A pupil can be in several groups at once, such as Disadvantaged, Pupil Premium and SEN. Disadvantaged and pupil premium are separate groups and can differ in size: 15 and 14 pupils in the example.
Subject Overview
Section titled “Subject Overview”Subject Overview puts each pupil’s judgements in one subject this year beside their earlier statutory results. Open it from Reports, or select the arrow beside a subject in Age Related Overview.
Options
Section titled “Options”| Option | What it does | Default |
|---|---|---|
| Academic year | The year to show | The current year |
| Periods | The assessment points to show as columns | Every point so far this year, plus summer 2 of the previous year |
| Summative against ARE, Test scores against ARE | Teachers’ judgements, or test scores | Summative against ARE |
| Subject | One primary subject | Reading |
There are no Display Options.
Read the report
Section titled “Read the report”Each row is a pupil, with flags such as PP and EAL. The Key Stage Outcomes columns come first. EYFS shows a related early learning goal, such as word reading, Phonics the phonics screening check mark and KS1 key stage 1 teacher assessment.
Each assessment point then has two columns. Summative is the judgement with its band number in front, such as 3 JA for Just At in Band 3. ARE shows which judgements count as at age-related expectations: JA/SA, meaning Just At or Securely At. The last column, Diff, compares the latest judgement with age-related expectations, where 0 means at expectations.
Sort by any column with the arrows under its heading. The arrow beside a pupil’s name opens their Single Pupil Overview.
| Column | Colours |
|---|---|
| EYFS | 2 green: expected. 1 yellow: emerging. |
| Phonics | Green or red, but the colour does not always match the threshold (see the points to watch) |
| KS1 | GDS purple: working at greater depth. EXS green: working at the expected standard. WTS yellow: working towards it. PK2 red: a pre-key stage standard. |
| Summative | 3 B pink, 3 JA yellow, 3 At light green and 3 A green for Below, Just At, Securely At and Above. 2 JA red for a judgement from a lower band. |
In year 4 reading, Douglas Allison has 1, 31 and EXS in the EYFS, phonics and KS1 columns. At the end of year 3 he was 2 JA, in red: Just At in the year 2 band. At autumn 1 he is 4 At, Securely At in the year 4 band. Aldrich Ralph had GDS at key stage 1 but was 3 B at the end of year 3, and has no autumn 1 judgement yet.
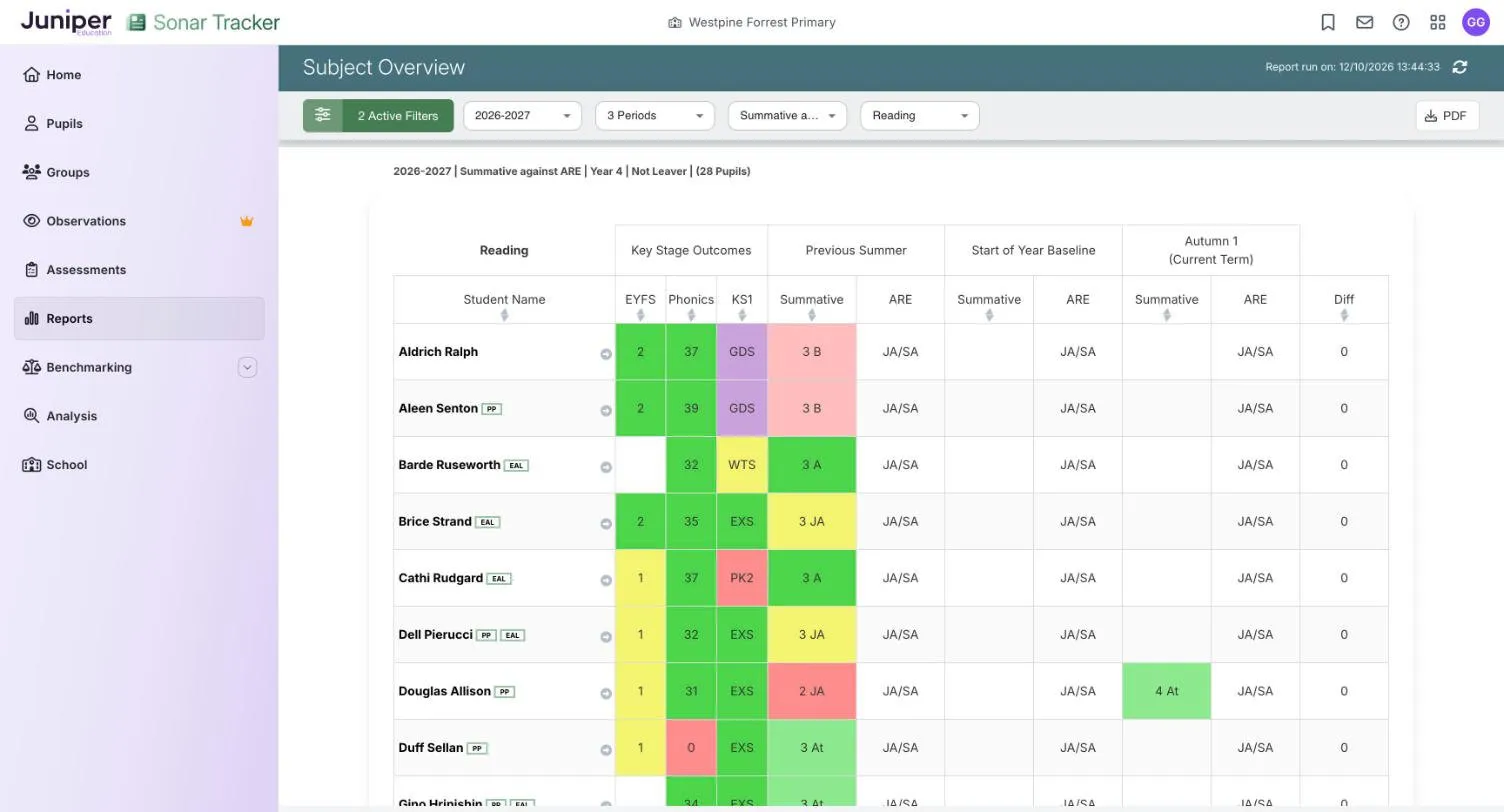
Test scores against ARE replaces each point’s columns with Score and Range. It stays empty until your school has entered test scores for that subject.
Points to watch
Section titled “Points to watch”Diff shows 0 for a pupil with no judgement at the latest point, such as Aldrich Ralph, as well as for a pupil at expectations. Read it with the Summative column.
A phonics mark can change colour between views: Douglas Allison’s 31 is green in Summative against ARE but red in Test scores against ARE. Check marks against the threshold the Standards and Testing Agency (STA) published for the year the pupil took the check.
Statutory columns are blank where Sonar holds no result, for example for a pupil who joined from another school. KS1 assessment has been optional since the 2023 to 2024 academic year, so some cohorts have no KS1 results.
Earlier judgements keep the band they came from, so the codes change from year to year. A pupil who goes from 3 JA to 4 JA has kept the same judgement, which is expected progress.