


 Sisra Analytics
Analysis and benchmarking
Pupil Overview
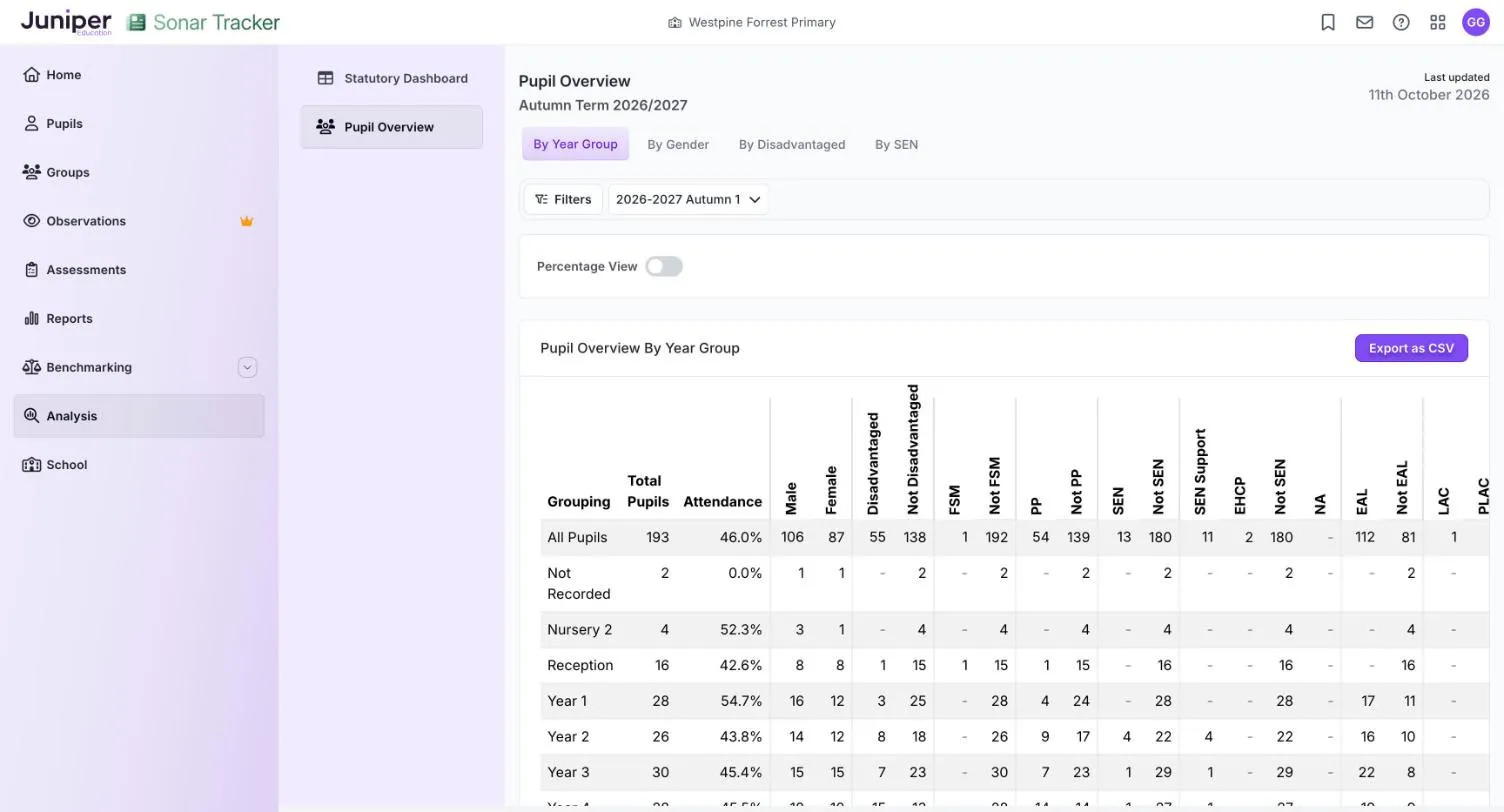
Pupil Overview counts how many pupils have each characteristic, such as pupil premium, with their attendance. Use it to give governors a picture of the school and to check that data from your management information system (MIS) has reached Sonar.
Where to find it: go to Analysis, then select Pupil Overview. Trusts see the same table across their schools in Sonar Multi-School: see Statutory Dashboard and Pupil Overview.
Options
Section titled “Options”| Option | What it does | Default |
|---|---|---|
| By Year Group, By Gender, By Disadvantaged, By SEN | Chooses how the rows are grouped | By Year Group |
| Filters | Narrows the pupils counted | Leavers excluded |
| Assessment point list | Chooses the point the table describes | The current point, such as 2026-2027 Autumn 1 |
| Percentage View | Shows percentages instead of numbers | Off |
Export as CSV downloads the table on screen as a CSV (comma-separated values) file for a spreadsheet.
Read the table
Section titled “Read the table”The heading shows the term, such as Autumn Term 2026/2027, and the date of the latest overnight refresh (Last updated). All Pupils covers the whole school, and the rows below split it by the grouping you chose.
| Column | What it counts |
|---|---|
| Grouping | The group in the row, such as Year 1 or Disadvantaged |
| Total Pupils | Pupils in the row with assessment data in at least one subject |
| Attendance | The average attendance of those pupils, from your MIS |
| Male, Female | Pupils by gender |
| Disadvantaged, Not Disadvantaged | Disadvantaged means eligible for free school meals at any time in the last six years, looked after, or previously looked after |
| FSM, Not FSM | Free school meals |
| PP, Not PP | Pupil premium |
| SEN, Not SEN | Pupils with and without special educational needs (SEN). SEN counts SEN support plus education, health and care (EHC) plans. |
| SEN Support, EHCP | Pupils on SEN support, and pupils with an EHC plan |
| NA | Pupils whose SEN status is recorded as not applicable |
| EAL, Not EAL | English as an additional language |
| LAC, PLAC | Looked-after children, and previously looked-after children |
Not SEN appears twice: the first includes pupils recorded as NA and the second does not. A hyphen means none are recorded.
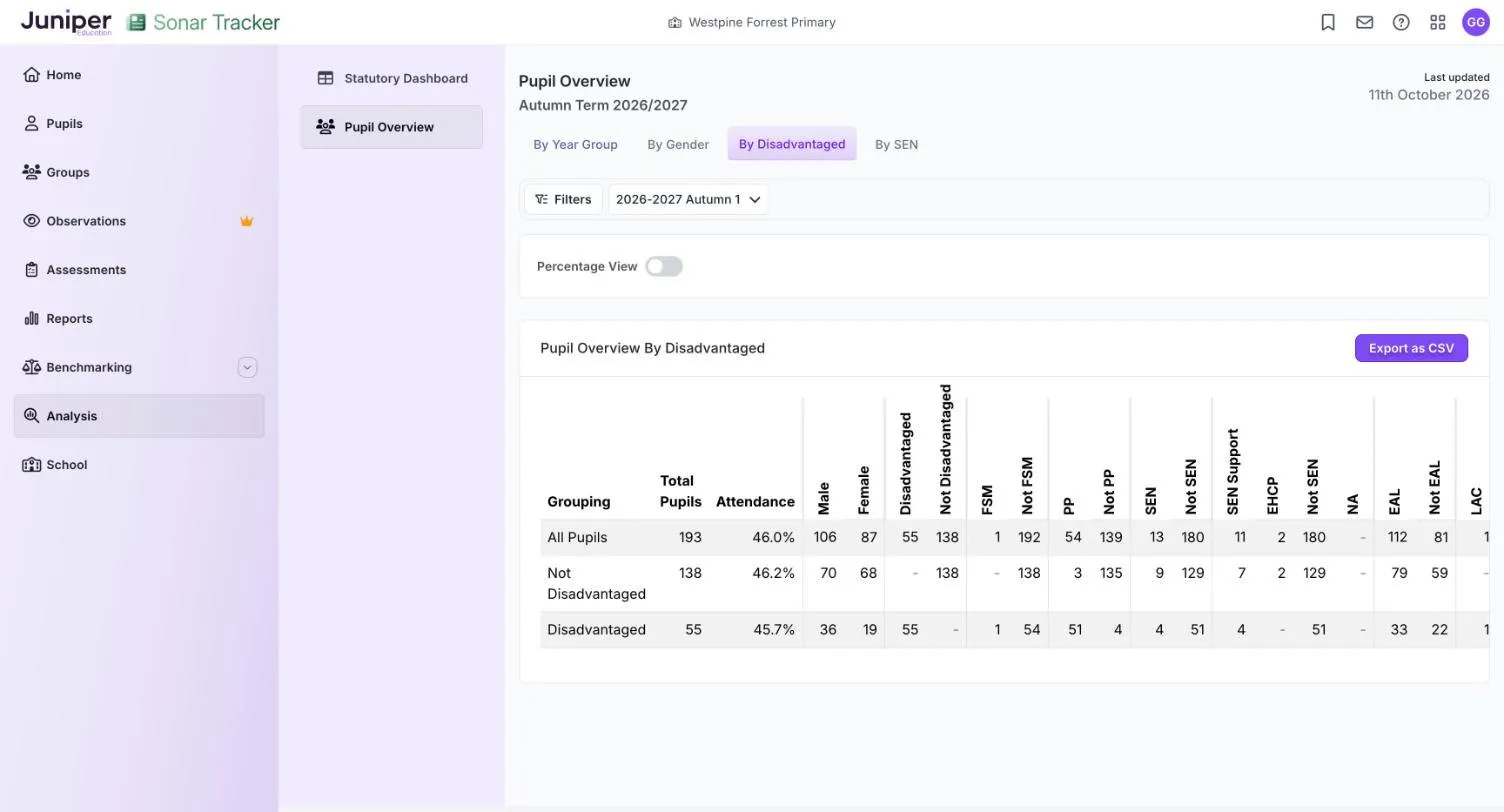
In the demo school at autumn 1, All Pupils is 193, with attendance of 46.0%. By Disadvantaged splits them into 55 disadvantaged pupils at 45.7% and 138 others at 46.2%.
Check pupil data
Section titled “Check pupil data”All Pupils should match the number of pupils on the Pupils page. In the demo school both show 193, including nursery children who have no judgements yet. If the figure is lower than your number on roll, check whether the missing pupils appear under Pupils: see How pupil data gets into Sonar.
A Not Recorded row means some pupils have no year group in the data Sonar received, as for 2 pupils in the demo school. Check their national curriculum year in your MIS, and Sonar picks up any correction overnight.
The columns also help you cross-check flags: in the demo, 3 pupils in the Not Disadvantaged row have PP. That can be right, but check them in your MIS.
Points to watch
Section titled “Points to watch”Attendance is one average for each row, taken from your MIS. It cannot show how many pupils are persistently absent (missing 10% or more of sessions). It can also hide a few pupils with very low attendance. To find them, filter a report by attendance.
An attendance of 0.0% can mean no figure has come through, as in the demo school’s Not Recorded row. Check your MIS before you quote it.
The table names no pupils, but a count of 1 or 2 can still identify a child. When you share it with governors, give numbers with percentages for small groups, and note the assessment point and filters the counts depend on.
Related pages
Section titled “Related pages”- How pupil data gets into Sonar
- Filter pupils
- Statutory Dashboard
- Statutory Dashboard and Pupil Overview in Sonar Multi-School