


 Sisra Analytics
Teacher assessment
Enter test scores
The Scores page records results from tests your school chooses to use, such as termly standardised tests or practice papers. Reports and the Triangulate panel show these scores beside your teacher judgements.
Statutory results, such as the KS2 tests and the phonics screening check, go on the statutory pages instead. See Statutory assessment in Sonar.
Before you start
Section titled “Before you start”You need:
- an edit role, such as Full Edit or Partial Edit
- score settings for the subjects and year groups you test
An Account Owner or Account Admin sets up two things on the School page, in the Assessment Settings card:
- Scores Range, the lowest and highest score Sonar accepts for each subject and year group
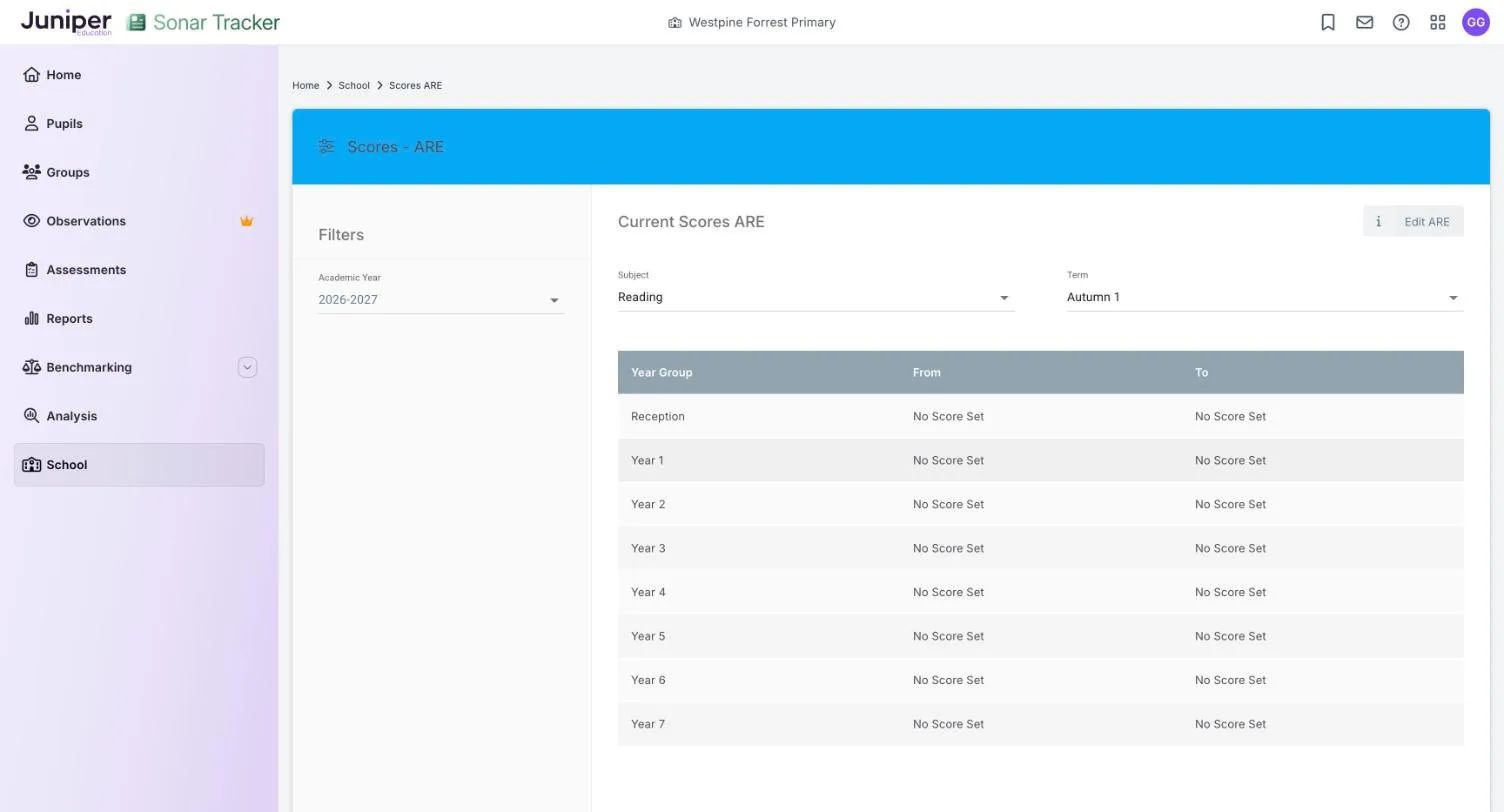
- Scores ARE, the band of scores that counts as at age-related expectations (ARE) for each subject, year group and term
Set up both before anyone enters scores. Assessment settings explains how.
Open the Scores page
Section titled “Open the Scores page”- Go to Assessments.
- In the Tests card, select Scores.
- In the Select Pupils box, choose a year group or a class.
- Select Load Assessment.
- Choose the term from the term list, such as Autumn 1.
- Choose the subject group, such as Core Subjects.
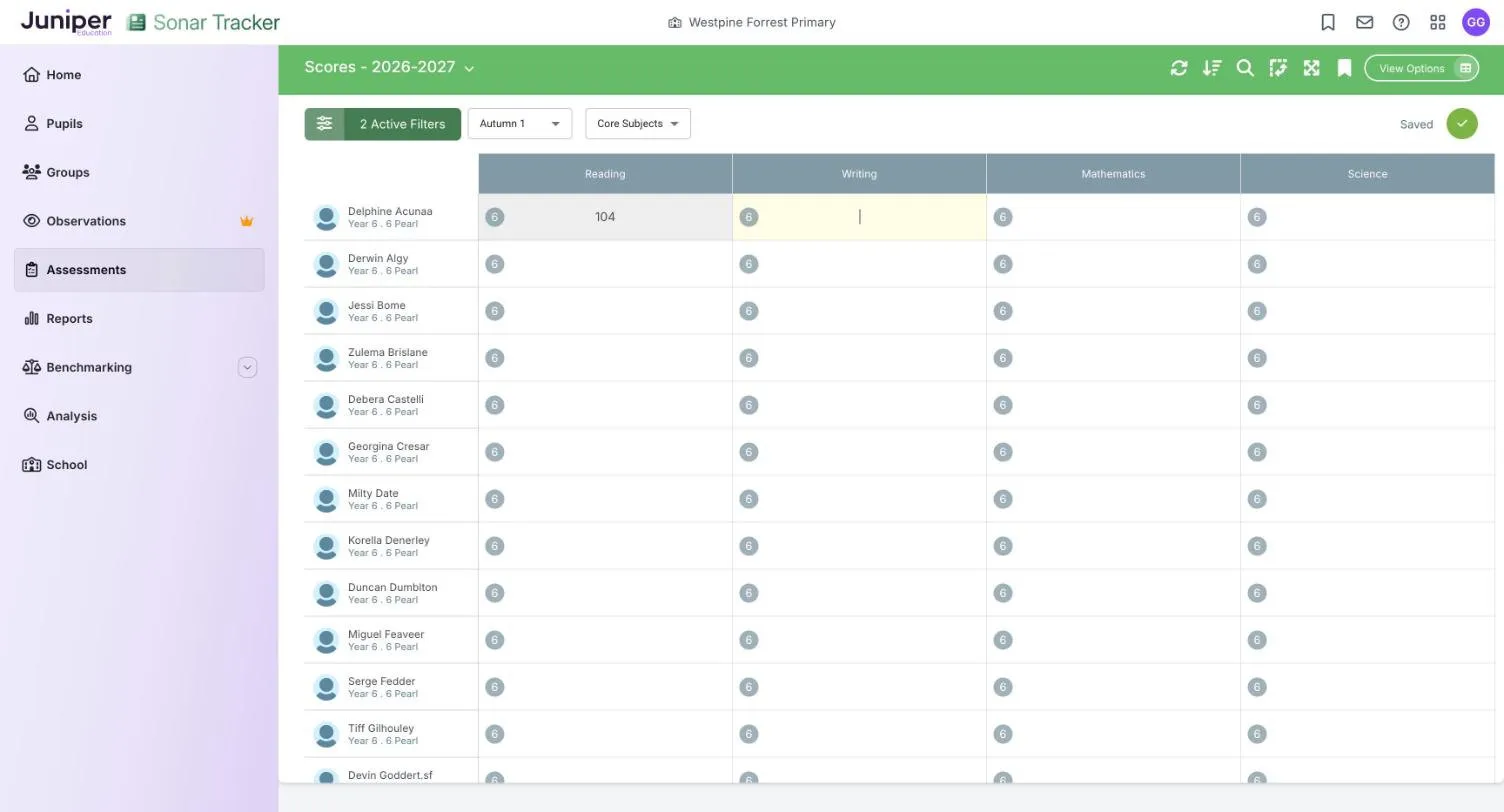
Each row is a pupil and each column a subject. To choose another academic year, select the title bar, such as Scores - 2026-2027.
Enter a score
Section titled “Enter a score”- Select the pupil’s cell under the subject.
- Enter the score.
- Press Tab.
Sonar saves the score, shows the Saved tick and moves to the next cell.
Pupils who sit another year’s paper
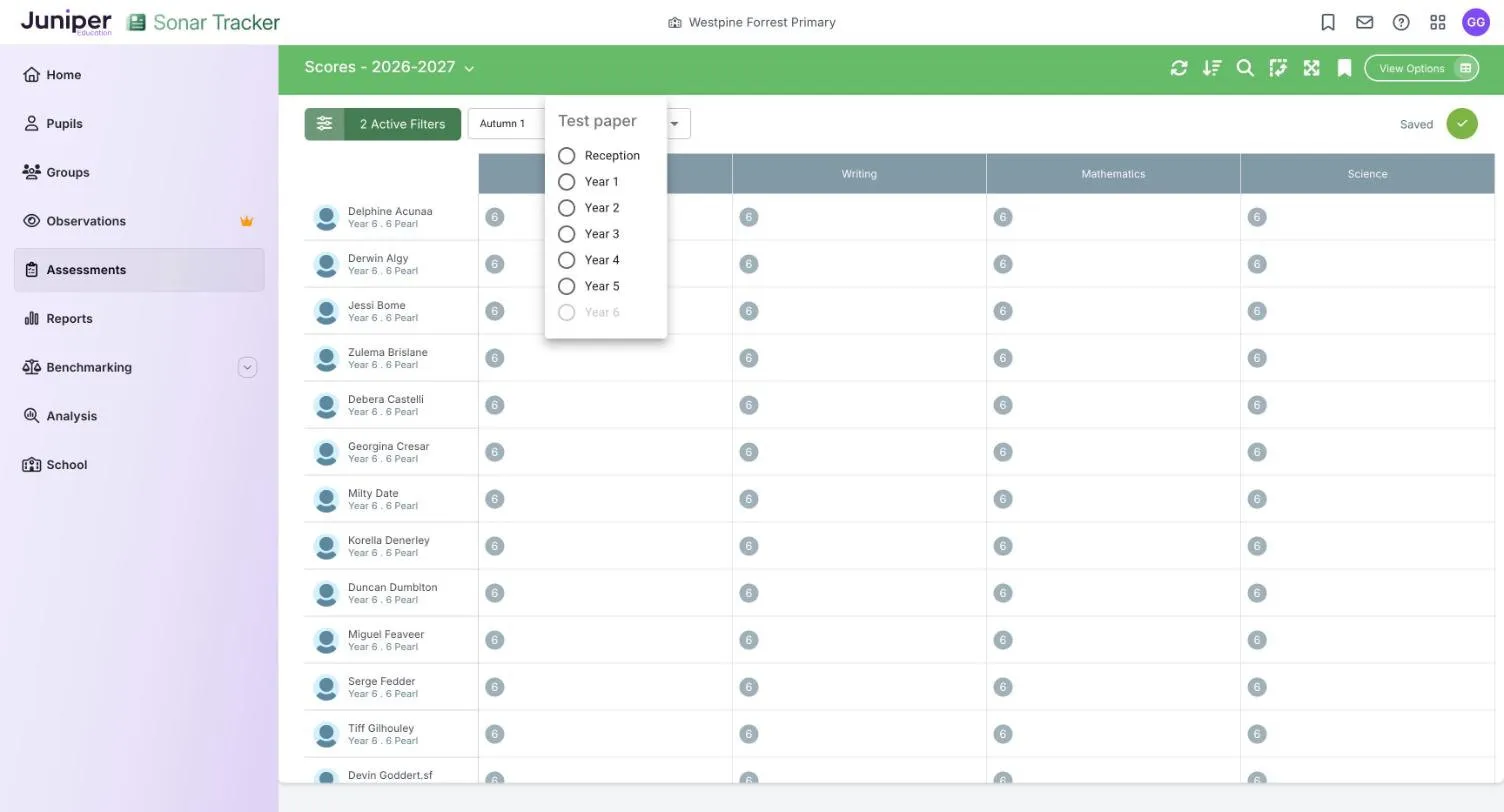
Section titled “Pupils who sit another year’s paper”The grey circle in each cell shows which year group’s test paper the score is for, such as 6 for a year 6 paper. If a pupil sat a paper meant for another year group:
- Select the grey circle in the pupil’s cell.
- In Test paper, choose the year of the paper they sat, such as Year 4.
- Enter the score.
In Subject Overview, a lower year’s paper counts as Significantly Below and a higher year’s as Significantly Above.
Why some scores show no colour
Section titled “Why some scores show no colour”Sonar colours a score by comparing it with the Scores ARE band for that subject, year group and term. Scores from the band’s From score to its To score count as at ARE, lower scores as below and higher scores as above. With a band of 100 to 109, for example, 99 or less is below and 110 or more is above.
Where Scores ARE shows No Score Set, Sonar cannot place the score and shows no colour. Ask your Account Owner or Account Admin to set the band.
Standardised scores and scaled scores
Section titled “Standardised scores and scaled scores”Check which kind of score your tests give before anyone sets the bands.
A standardised score compares a pupil with a large national sample who took the same test. A score of 100 is the average, and about two-thirds of pupils score between 85 and 115. Commercial tests, such as NFER’s, usually report scores like this. An age-standardised score compares the pupil with others of the same age.
A KS2 scaled score comes from the national curriculum tests and runs from 80 to 120. A score of 100 or more means the pupil met the expected standard, not that they are average.
So a score of 100 means something different on each scale. Do not compare the two directly, and set your Scores ARE bands to suit the tests you use. NFER explains standardised scores, and GOV.UK explains scaled scores at key stage 2.
Educational ages
Section titled “Educational ages”Some schools record educational ages, such as reading ages, on an Ages page under Assessments. The page appears only where Juniper Education has switched it on, so ask Juniper support if your school needs it. On Ages, you choose each pupil’s educational age for a subject from a list. Primary Age Related Overview can then compare it with their actual age.
Where test scores appear
Section titled “Where test scores appear”Your test scores appear in:
- Triangulate on the summative pages, as Test (Check other evidence before you decide)
- Test Performance Progress, which tracks the share of pupils on track or higher against your Scores ARE bands (Progress reports)
- Primary Age Related Overview, when you choose Test scores against ARE (Age Related Overview)
- Subject Overview, when you choose Test scores against ARE, with a column for each assessment point (Attainment reports)
- Primary Triangulation of Data Analysis and Primary Projection Pathway, in their test score columns
If something goes wrong
Section titled “If something goes wrong”Scores show no colour. No Scores ARE band is set: see Why some scores show no colour.
You see “No validation set up for this Subject or Year Group - Please contact support”. No Scores Range is set for that subject and year group. Ask your Account Owner or Account Admin to set one, or contact Juniper support.
A score will not save. Check that it falls inside the Scores Range for that subject and year group.
No pupils appear. Choose a year group or a class, not both. Classes with no pupils still appear in the Class list.