


 Sisra Analytics
Sonar Multi-School
Statutory Dashboard and Pupil Overview
The Statutory Dashboard shows statutory results across the trust for one academic year, compared with the year before and with national figures. Pupil Overview shows how many pupils in each school have each characteristic, with their attendance.
Schools see the same two pages for their own school under Analysis in Sonar Tracker. See Statutory Dashboard in Sonar Tracker and Pupil Overview in Sonar Tracker.
Statutory Dashboard
Section titled “Statutory Dashboard”Where to find it: Statutory Dashboard in the main menu.
Who can see it: trust users whose role includes statutory reports.
The dashboard works by academic year, not assessment point. In October 2026, for example, it opens on 2025-2026, the year with the latest results. Select the year at the top of the page to change it, and Print to print what is on screen.
Each figure counts eligible pupils only: pupils in the right year group, not leavers, who have the results the measure needs. Figures refresh overnight, and Last updated shows the date.
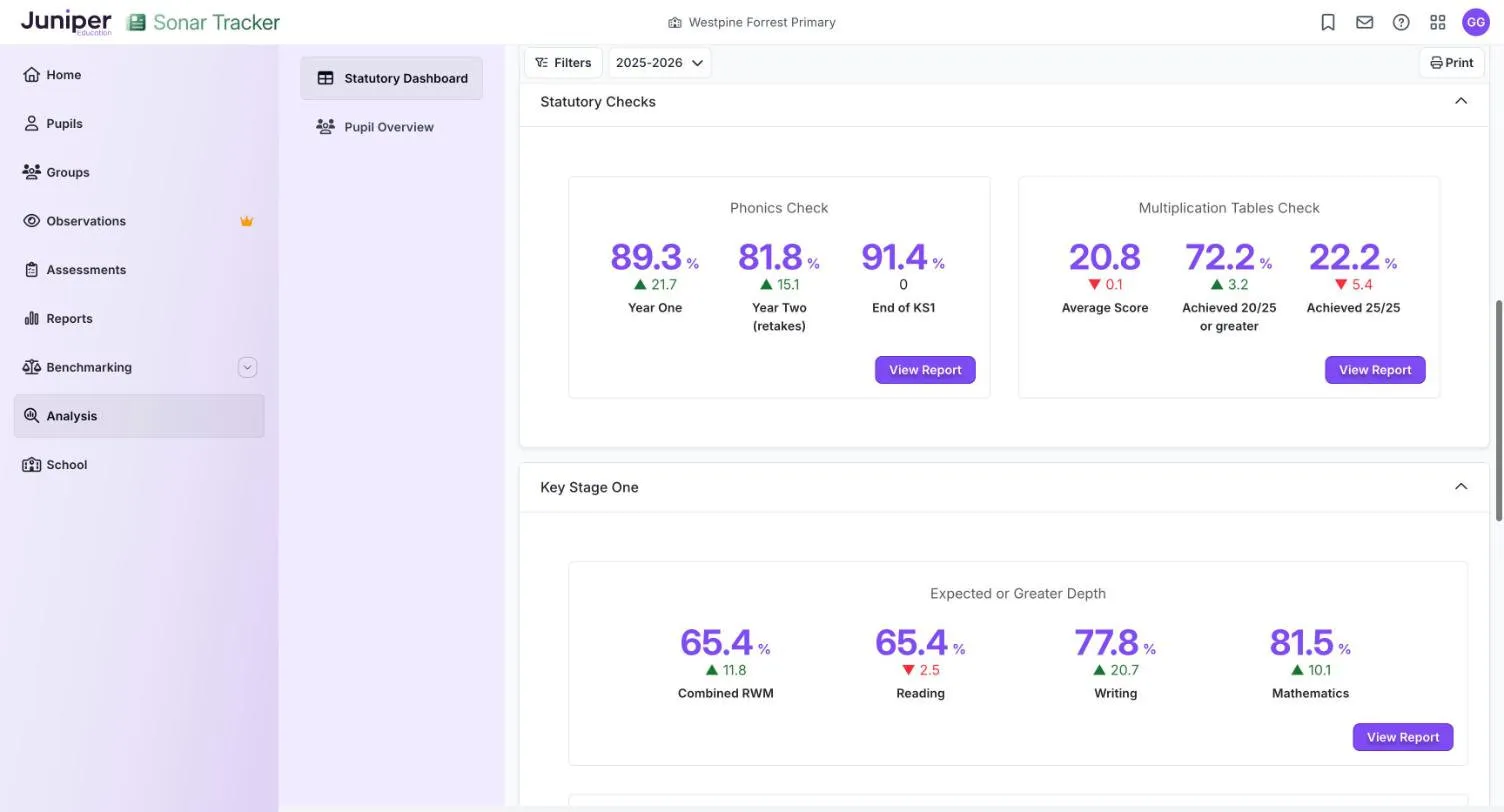
Each figure also shows its change since the previous academic year, in percentage points. A rise shows in green with an up arrow, such as ▲ 8.9 for 52.5% this year against 43.6% last year. A fall shows in red with a down arrow, such as ▼ 0.1, and no change shows as 0.
Statutory Attainment Headline Summary
Section titled “Statutory Attainment Headline Summary”Three cards repeat the main figures from the widgets that follow. EYFS has the good level of development (GLD). KS1 has the phonics check in year 1 and by the end of KS1, and reading, writing and maths (RWM) combined. KS2 has RWM combined and the multiplication tables check (MTC) average score, although pupils take the check in year 4.
EYFS Profile
Section titled “EYFS Profile”| Figure | What it shows |
|---|---|
| Good Level of Development | Percentage of eligible pupils who reached GLD at the end of reception |
| Achieved All Goals | Percentage at the expected level in all 17 early learning goals |
| Average Number of Goals | The average number of goals at the expected level, out of 17 |
The cohort is the reception class for the selected year. A pupil is eligible if they have a result in all 17 goals: 1 (emerging), 2 (expected) or A (exempt). Pupils with no results, or with results for only some goals, are left out. For example, if 28 of the 30 children in reception have a result in all 17 goals, all three figures use those 28.
Statutory Checks
Section titled “Statutory Checks”The Phonics Check card has three figures:
| Figure | What it shows | Who is counted |
|---|---|---|
| Year One | Percentage who met the expected standard in year 1 | Year 1 pupils with a year 1 mark or code |
| Year Two (retakes) | Percentage who met it in year 2, having not taken it or not met it in year 1 | Year 2 pupils with a year 2 result |
| End of KS1 | Percentage who met it by the end of year 2 | Year 2 pupils with a year 1 or year 2 result. If a pupil has both, the year 2 result counts. |
The expected standard is the threshold mark that the Standards and Testing Agency (STA) sets each year.
For example, year 2 has 30 pupils. Of these, 21 have only a year 1 result, 8 have a year 2 result and 1 has no result. End of KS1 is worked out from 29 pupils, and Year Two (retakes) from 8.
The Multiplication Tables Check card has three figures:
| Figure | What it shows |
|---|---|
| Average Score | The average score of eligible pupils, out of 25 |
| Achieved 20/25 or greater | Percentage of eligible pupils who scored 20 or more |
| Achieved 25/25 | Percentage who scored full marks |
The check has no pass mark, so the two thresholds show how scores are spread. Year 4 pupils with a result are counted. If 29 of the 30 pupils in year 4 have a score, the average is their total score divided by 29. Ask Juniper support how pupils with a code instead of a score, such as A (absent), are counted.
Key Stage One
Section titled “Key Stage One”Two cards, Expected or Greater Depth and Greater Depth, each show Combined RWM, Reading, Writing and Mathematics, with their own View Report.
Year 2 pupils are counted if they have a teacher assessment in the subject, or in all of reading, writing and maths for Combined RWM. Test scores on their own do not count, and science is not part of the combined measure.
For example, in a year 2 of 30, 28 pupils have reading and writing teacher assessments, and 27 of them also have maths. Reading and writing are worked out from 28 pupils, and maths and Combined RWM from 27.
KS1 assessment has been optional since the 2023 to 2024 academic year, so expect no figures from schools that chose not to assess.
Key Stage Two
Section titled “Key Stage Two”This widget has the same two cards for the end of KS2, with Grammar, Punctuation and Spelling as well as the four measures above. For reading and maths, Greater Depth here means the higher standard: a scaled score of 110 or more. Greater depth is strictly a writing term.
Year 6 pupils are counted if they have:
- for reading and maths, a test result (a raw score, scaled score or test outcome), or otherwise a teacher assessment
- for writing, a teacher assessment
- for Combined RWM, a result in all three of reading, writing and maths
A pupil with only a teacher assessment in reading or maths is counted, but cannot meet the expected standard.
For example, in a year 6 of 30, 29 pupils have reading and writing results, and 28 of them also have a maths result. Reading and writing are worked out from 29 pupils, and maths and Combined RWM from 28.
Reports and national figures
Section titled “Reports and national figures”View Report on a widget opens charts and expandable tables for that measure, which you can print. Group them By School, By Gender, By Disadvantaged, By Pupil Premium or By SEN (special educational needs).
The tables give the trust’s figure for the selected year and the year before, the national figure and the change. No in Cohort gives the number of pupils counted. The colour of the selected year’s figure shows how it compares with the national figure.
National figures come from the DfE’s Explore Education Statistics. They appear once the DfE publishes them, first as provisional figures and later revised.
Cohort sizes
Section titled “Cohort sizes”Check No in Cohort before you compare schools or groups. One school’s year 6, or its disadvantaged pupils in one year group, may be a handful of pupils. In a group of 8, each pupil is worth 12.5 percentage points.
Pupil Overview
Section titled “Pupil Overview”Where to find it: Pupil Overview in the main menu.
Pupil Overview is a table of pupil numbers by characteristic, with attendance, at one assessment point. Group it By School (the default), By Year Group, By Gender, By Disadvantaged or By SEN.
It counts only pupils with assessment data, so it is not the number on roll. A pupil new to a school is missing until they have a judgement. Turn on Percentage View to see percentages instead of numbers, or select Export as CSV to save the table.
| Column | What it counts |
|---|---|
| Total Pupils | Pupils with assessment data |
| Attendance | The group’s attendance, as a percentage |
| Male, Female | Pupils by gender |
| Disadvantaged, Not Disadvantaged | See View options |
| FSM, Not FSM | Free school meals |
| PP, Not PP | Pupil premium |
| SEN | Special educational needs: SEN Support plus EHCP |
| Not SEN (first) | Pupils recorded as having no SEN, plus those recorded as NA |
| SEN Support | Pupils on SEN support (code K) |
| EHCP | Pupils with an education, health and care (EHC) plan (code E) |
| Not SEN (second) | Pupils recorded as having no SEN (code N) only |
| NA | Pupils whose SEN status is recorded as not applicable |
| EAL, Not EAL | English as an additional language |
| LAC, Not LAC | Looked-after children, and pupils who are not looked after |
| PLAC | Previously looked-after children: adopted, or under a special guardianship order or a child arrangements order |
A hyphen means no data is recorded for that group.
For example, a SEN figure of 87 is 73 pupils on SEN support plus 14 with an EHC plan. A first Not SEN figure of 193 is 183 pupils recorded as having no SEN plus 10 recorded as NA.