


 Sisra Analytics
Analysis and benchmarking
Benchmarking
Benchmarking compares your school’s summative judgements with those of other schools that use Sonar, nationally and in your local authority. It runs at autumn 2, spring 2 and summer 2 only.
Where to find it: select Benchmarking in the left menu, then EYFS or Primary.
Who can see it: schools with the Benchmarking module. Without it, Benchmarking shows a crown icon and opens an information page.
What Benchmarking compares
Section titled “What Benchmarking compares”| Figure | What it is |
|---|---|
| School | Your school’s results for each subject and year group, live from Sonar |
| Juniper National | The average for all Sonar schools nationally |
| Juniper LA | The average for Sonar schools in your local authority |
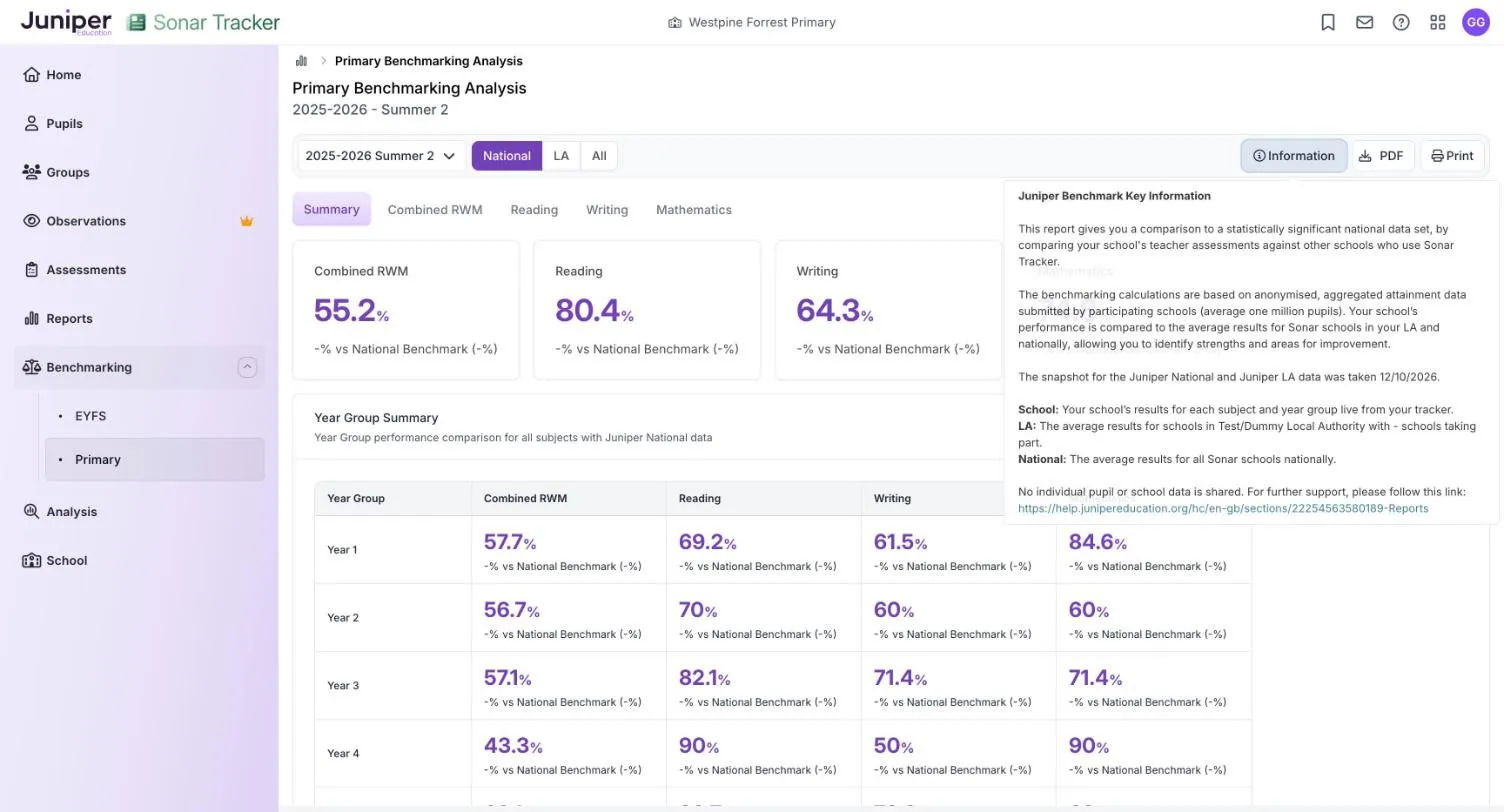
The national and local authority figures come from anonymised teacher assessments for about a million pupils in Sonar schools. They are a snapshot, taken on the date Information gives, and no individual pupil or school data is shared.
Options
Section titled “Options”| Option | What it does | Default |
|---|---|---|
| Assessment point list | Chooses the benchmarking point: autumn 2, spring 2 or summer 2, for the years your subscription covers | The latest point, such as 2025-2026 Summer 2 |
| National, LA, All | Chooses the benchmark: Juniper National, Juniper LA or both | National |
| Tabs | Primary: Summary, Combined RWM, Reading, Writing and Mathematics. EYFS: Summary, then Tracking GLD and Tracking All Goals for each year group. | Summary |
Read the primary report
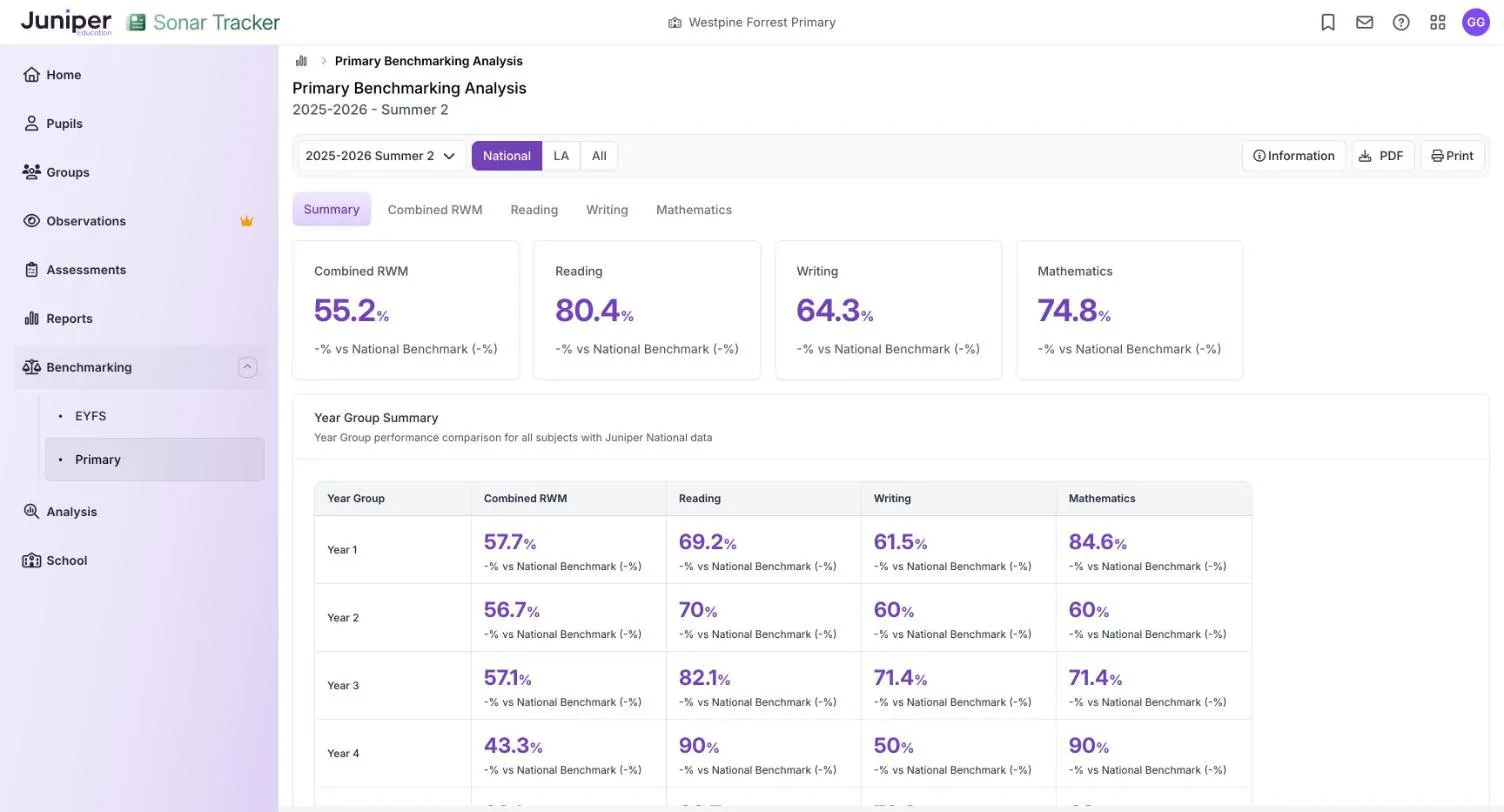
Section titled “Read the primary report”The Summary tab has a card each for Combined RWM (reading, writing and maths), Reading, Writing and Mathematics. Each card gives the percentage of your pupils in years 1 to 6 judged at or above age-related expectations (ARE). The line under it, such as -% vs National Benchmark (-%), gives the difference from the benchmark and then the benchmark itself in brackets. Year Group Summary repeats them for each year group. A dash means there is no figure for that selection.
At summer 2 of the 2025 to 2026 academic year, 55.2% of the demo school’s pupils were at or above ARE in combined RWM. In Year Group Summary, the Year 4 row shows 90% in reading and maths, 50% in writing and 43.3% combined. No benchmark is available for the demo school, so each comparison shows dashes.
Further down, Contextual Group Analysis, Ethnicity Analysis and Attendance Analysis cover groups of pupils. Their tables give your figure and its difference from each benchmark, coloured by the size of the gap:
| Colour | Difference from the benchmark |
|---|---|
| Significantly Above green | 10 or more percentage points above |
| Slightly Above light green | 2.6 to 9.9 points above |
| Within yellow | Within 2.5 points either way |
| Slightly Below peach | 2.6 to 9.9 points below |
| Significantly Below red | 10 or more points below |
On the cards, a difference above the benchmark shows in green (above) and one below it in red (below).
Read the EYFS report
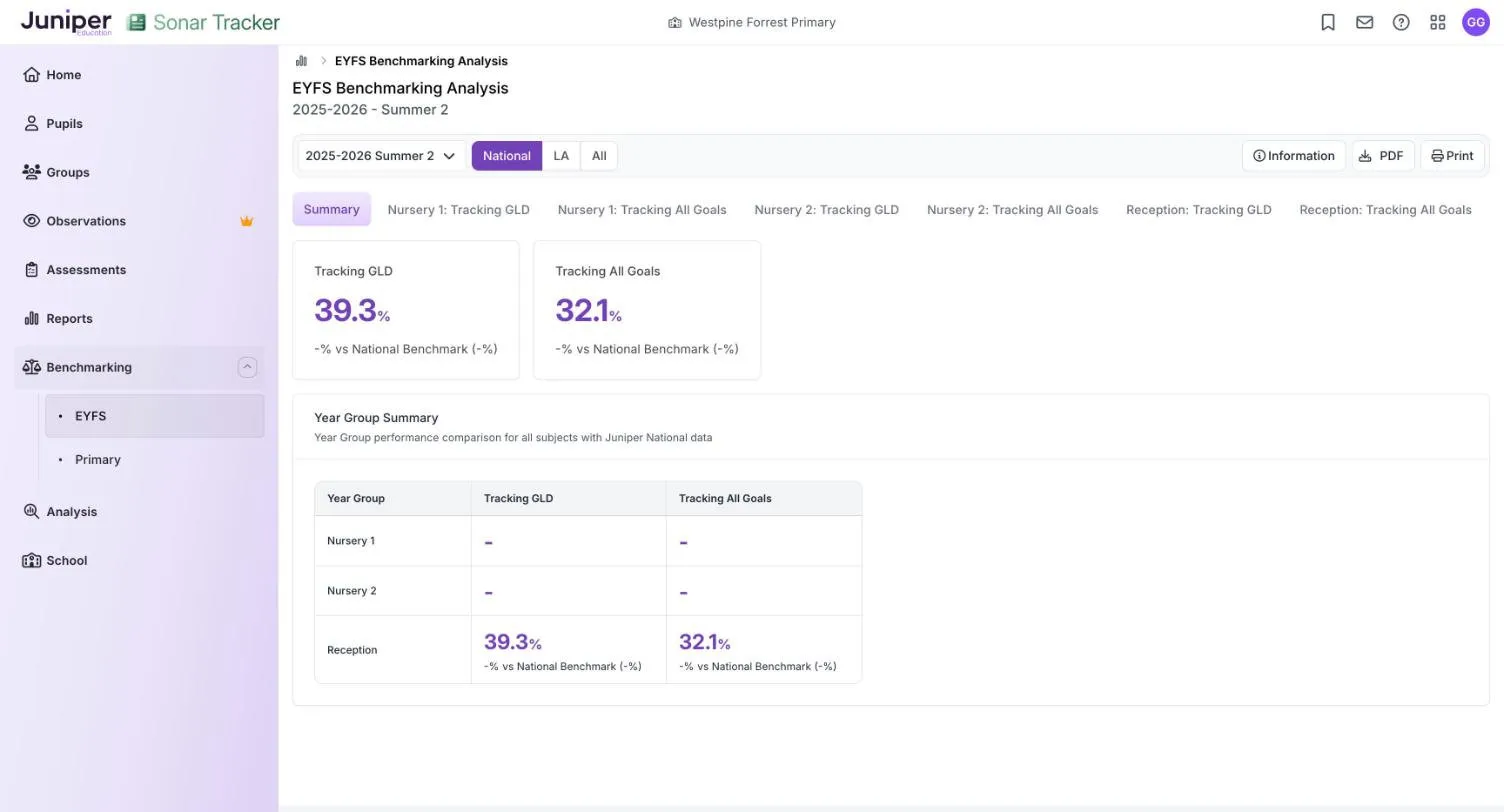
Section titled “Read the EYFS report”The EYFS report has two measures. Tracking GLD is the share of children on track in all 12 goals that make up a good level of development (GLD). Tracking All Goals is the share on track in all 17 early learning goals (ELGs). The tabs show each measure for each year group, such as Reception: Tracking GLD.
Children can only reach GLD at the end of reception, so these measures show whether they are on track for it. Nursery year groups are included so that you can see shortfalls while there is still time to change support.
EYFS benchmarking needs judgements in all 17 ELGs, not only in the seven areas of learning. It does not show individual goals: for those, use the EYFS reports.
At summer 2 of the 2025 to 2026 academic year, the demo school’s Reception shows Tracking GLD at 39.3% and Tracking All Goals at 32.1%. Nursery 1 and Nursery 2 show dashes.
How the percentages are calculated
Section titled “How the percentages are calculated”Your school’s figure is the percentage of all the pupils in a year group judged at or above ARE. The benchmark is worked out the same way from every pupil in that year group across the schools in it. Because it pools pupils rather than averaging schools’ percentages, larger schools carry more weight.
The year group total includes pupils with no judgement, so a missing judgement lowers your figure. Juniper Education announces a data entry deadline for each benchmarking point in Sonar News on the Home page. Judgements entered by then go into the next benchmark, so check for gaps with the Summative Data Check Summary before the deadline.
Points to watch
Section titled “Points to watch”The figures are teachers’ judgements, not test results, and schools do not moderate them against each other. A difference from the benchmark can reflect how schools judge as well as what pupils know.
The comparison is with schools that use Sonar, not with every school in England, and it is not the DfE’s national data. The number of Sonar schools also varies between local authorities, so the local authority benchmark may rest on only a few schools.
Your school’s figures are live and change as teachers enter judgements, but the benchmarks stay fixed at the snapshot date. Compare the two once your judgements for the point are complete.
Do not roll your management information system (MIS) over to the new academic year before 1 August. An earlier rollover affects your school’s data, including benchmarking. See The new academic year.